As the coronavirus pandemic continues to wreak havoc on global and domestic economies, housing has thus far proven resilient, managing a V-shaped recovery from the low point reached in April. The strong rebound is largely a result of two dynamics that existed before the pandemic and have continued or even gained strength in the last few months.
“The supply and demand imbalance that existed entering the pandemic has persisted, and even worsened, meaning house price growth will likely remain strong this summer.”
Mortgage rates were falling before the pandemic, and just last week they fell below 3 percent for the first time ever. Demographic demand from millennials aging into their prime homeownership years continues to benefit housing as well. Both of these dynamics help boost demand. However, another key trend has also strengthened amid the pandemic – an already tight inventory of homes has now reached record low levels and continues to move lower. The housing market amid the pandemic faces a significant supply and demand imbalance, and the result is accelerating price appreciation. In fact, based on current trends, we expect house price appreciation nationally to remain strong, and even accelerate in many markets this summer.
House-buying power, how much home one can afford to buy given their income and the prevailing 30-year, fixed mortgage rate, continues to outpace nominal house price appreciation nationally, resulting in a 7.3 percent improvement in affordability in May relative to one year ago. Fast forward to July, and mortgage rates are now below three percent, and it’s possible that they could fall further. With rates falling, but house price appreciation anticipated to increase, what is likely to happen to affordability over the next few months?
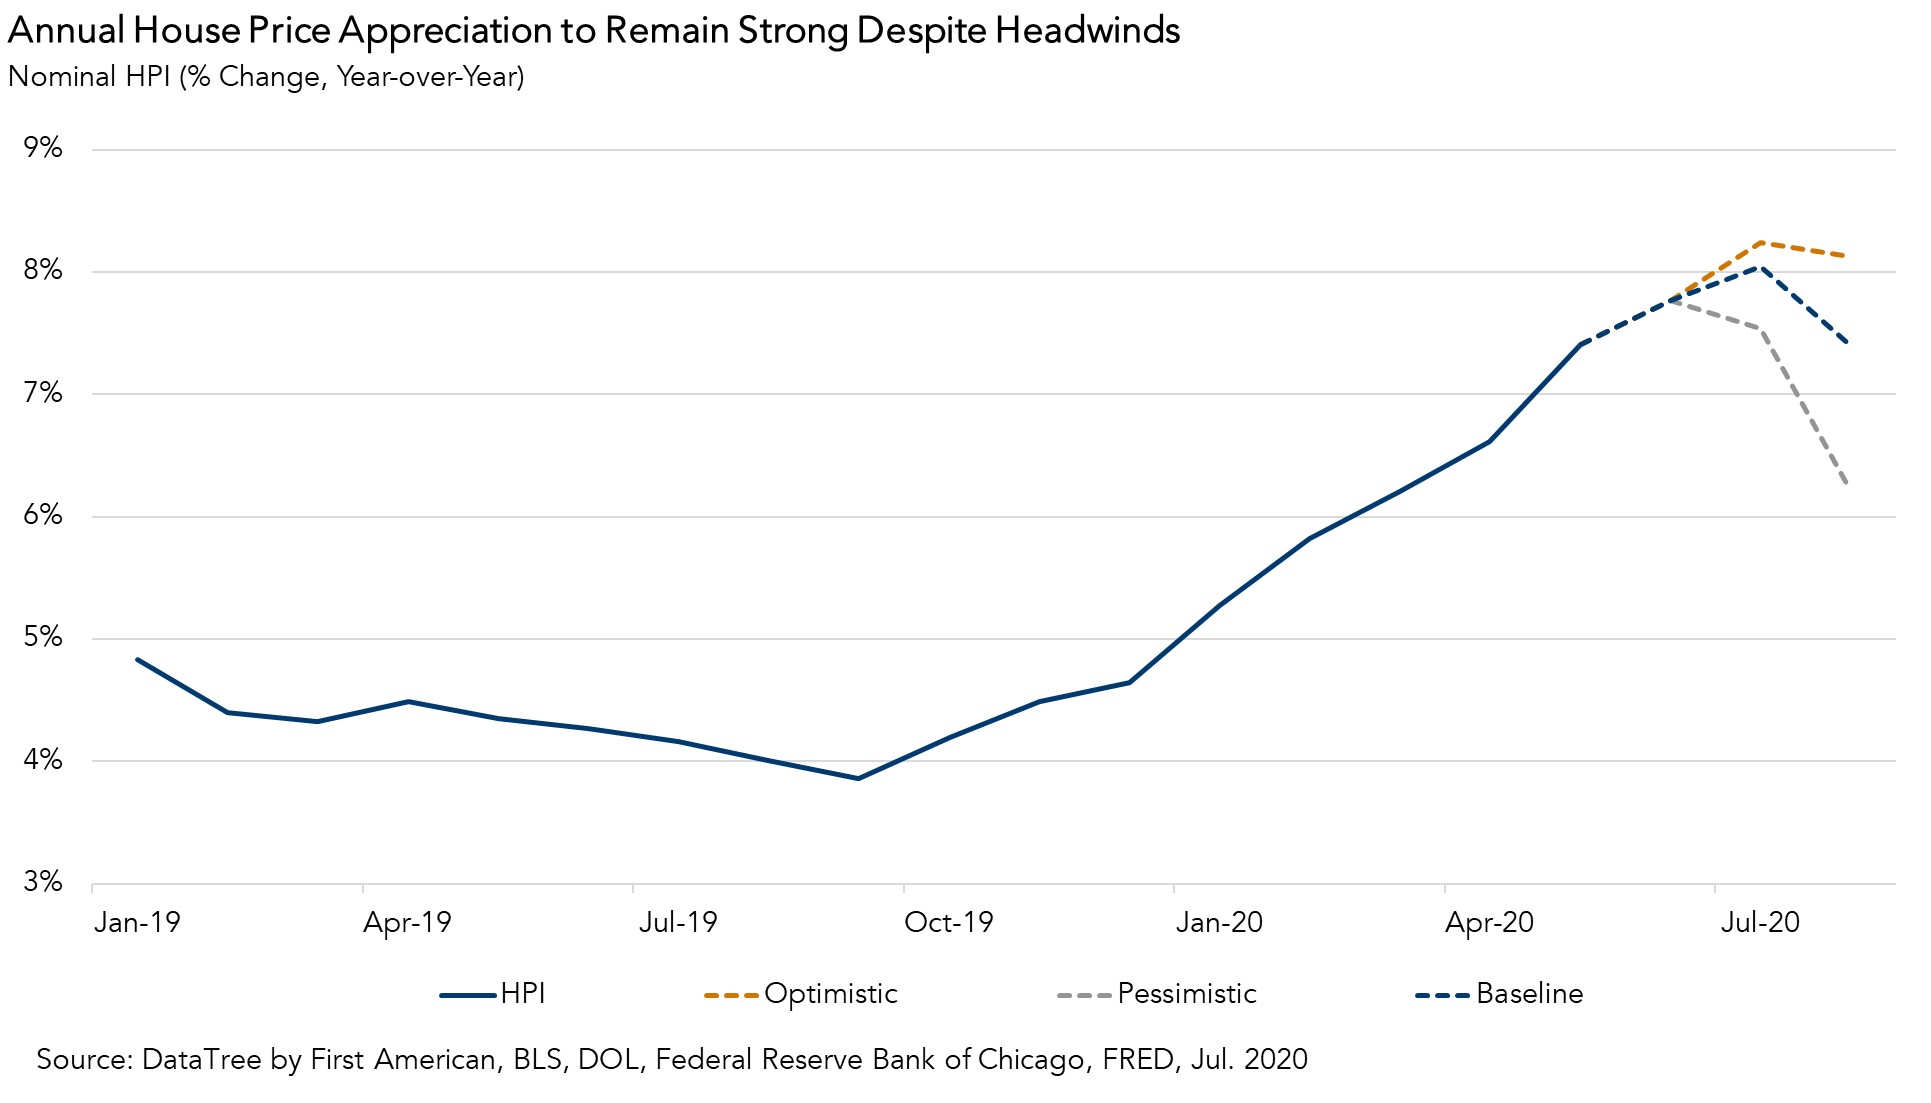
Can House Price Appreciation Weather the Summer Surge in COVID-19?
Nominal house prices increased by 7.4 percent in May compared with one year ago and we expect that June year-over-year growth will be even higher. However, there has been a resurgence of COVID-19 in major states and in many major housing markets in June and July. The question is whether the pace of house price appreciation is sustainable under these conditions.
In times of economic trouble, weakness in the labor market negatively impacts the housing market – household income growth typically slows or declines and economic uncertainty reduces supply and demand. Yet, housing also usually benefits from lower mortgage rates as monetary policy eases and investors flee to the safety of treasury bonds. These two factors, household income and mortgage rates, will ultimately drive house-buying power and whether or not house-buying power can keep up with house price appreciation in the weeks and months ahead.
To assess how house prices may react this summer, we ran three labor market and mortgage rate scenarios for July and August. Under an optimistic scenario with continued labor market improvement and consistently low rates, continued strong demand against a limited supply of homes for sale pushes house price appreciation to accelerate in July and remain strong in August. If the labor market limps along, the demand will not be quite as strong, but the momentum of house price appreciation remains. Even under a pessimistic outlook for the labor market, the housing market would benefit from a house-buying power boost as mortgage rates are likely to be pressured lower. In this case, house price appreciation remains strong, but doesn’t accelerate. The supply and demand imbalance that existed entering the pandemic has persisted, and even worsened, meaning house price growth will likely remain strong this summer.
The Role of Mortgage Rates in Boosting House-Buying Power
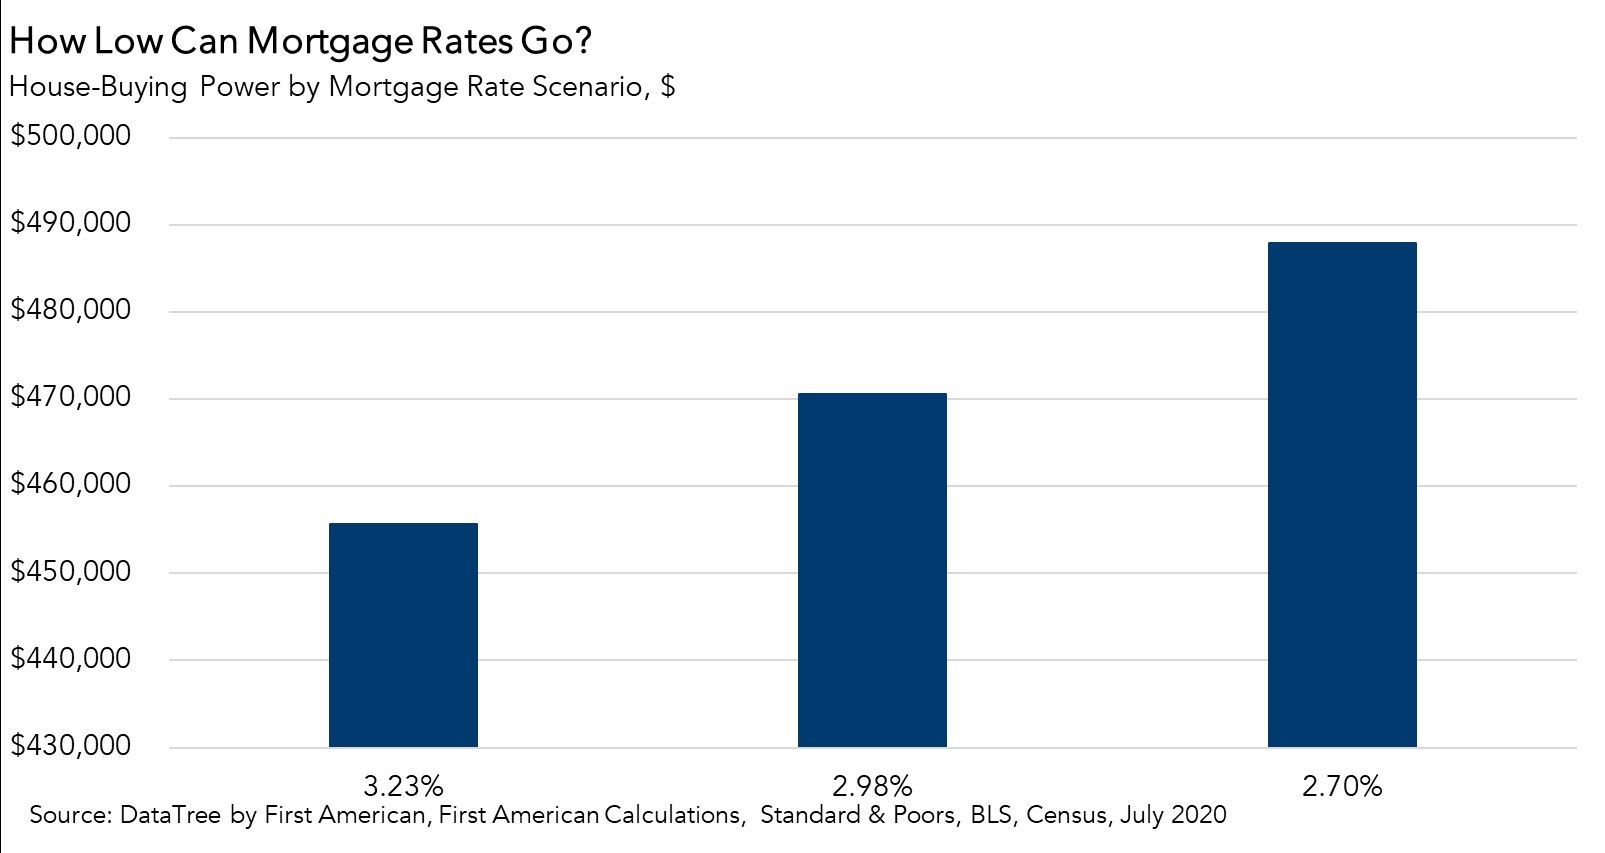
Nominal house price appreciation benefits the existing homeowner, as their home increases in value, their equity increases. However, nominal house price appreciation hurts the prospective first-time homebuyer. As house prices go up, it becomes harder for buyers to afford a home, unless house-buying power can keep up with house prices. In July, house-buying power got a big boost as the 30-year, fixed mortgage rate made history by moving below three percent. That drop in the mortgage rate from 3.23 percent in May to 2.98 percent in July increased house-buying power by nearly $15,000. It’s been said that mortgage rates could fall to as low as 2.7 percent. If that happens, house-buying power nationally would increase to $488,000, a $32,000 boost to affordability compared with May.
The Interplay Between Rates, Income, And Nominal House Price Appreciation.
We expect that house price appreciation will persist, and even accelerate, for the remainder of the summer. However, even assuming a 1 percent decline in household income (relative to May), a mortgage rate of 2.9 percent, and house price appreciation growth of 8.0 percent (compared with 7.4 percent in May), our Real House Price Index (RHPI) would still be 2.4 percent lower than in May, meaning affordability would still improve. Obviously, the pandemic continues to impact the labor market and economy, but our analysis indicates that potential buyers remain positioned to reap the benefit from the historically low rate environment.
For more analysis of affordability, please visit the Real House Price Index.
The RHPI is updated monthly with new data. Look for the next edition of the RHPI the week of August 24, 2020.
Sources:
May 2020 Real House Price Index Highlights
*NOTE: This month’s report reflects a revision to the income series, which may result in revised historical RHPI values.
The First American Real House Price Index (RHPI) showed that in May 2020:
- Real house prices decreased 0.3 percent between April 2020 and May 2020.
- Real house prices declined 7.3 percent between May 2019 and May 2020.
- Consumer house-buying power, how much one can buy based on changes in income and interest rates, increased 1.3 percent between April 2020 and May 2020, and increased 15.9 percent year over year.
- Median household income has increased 4.5 percent since May 2019 and 62.8 percent since January 2000.
- Real house prices are 21.8 percent less expensive than in January 2000.
- While unadjusted house prices are now 12.5 percent above the housing boom peak in 2006, real, house-buying power-adjusted house prices remain 44.5 percent below their 2006 housing boom peak.
May 2020 Real House Price State Highlights
- The five states with the greatest year-over-year increase in the RHPI are: Vermont (+6.7 percent), Oklahoma (+3.7 percent), Montana (+3.5 percent), Texas (+3.2 percent), and Georgia (+2.8 percent).
- The five states with the greatest year-over-year decrease in the RHPI are: Louisiana (-11.5 percent), New Hampshire (-9.5 percent), West Virginia (-9.3 percent), South Dakota (-7.7 percent), and New Jersey (-7.5 percent).
May 2020 Real House Price Local Market Highlights
- Among the Core Based Statistical Areas (CBSAs) tracked by First American, the five markets with the greatest year-over-year increase in the RHPI are: New York (+14.8 percent), San Diego (+10.1 percent), Pittsburgh (+8.8 percent), Orlando (+6.3 percent), and St. Louis (+5.4 percent).
- Among the Core Based Statistical Areas (CBSAs) tracked by First American, the five markets with the greatest year-over-year decrease in the RHPI are: Las Vegas (-24.5 percent), Providence, R.I. (-14.1 percent), Boston (-7.5 percent), Chicago (-7.4 percent), and Cleveland (-7.3 percent).
About the First American Real House Price Index
The traditional perspective on house prices is fixated on the actual prices and the changes in those prices, which overlooks what matters to potential buyers - their purchasing power, or how much they can afford to buy. First American’s proprietary Real House Price Index (RHPI) adjusts prices for purchasing power by considering how income levels and interest rates influence the amount one can borrow.
The RHPI uses a weighted repeat-sales house price index that measures the price movements of single-family residential properties by time and across geographies, adjusted for the influence of income and interest rate changes on consumer house-buying power. The index is set to equal 100 in January 2000. Changing incomes and interest rates either increase or decrease consumer house-buying power. When incomes rise and mortgage rates fall, consumer house-buying power increases, acting as a deflator of increases in the house price level. For example, if the house price index increases by three percent, but the combination of rising incomes and falling mortgage rates increase consumer buying power over the same period by two percent, then the Real House Price index only increases by 1 percent. The Real House Price Index reflects changes in house prices, but also accounts for changes in consumer house-buying power.
Disclaimer
Opinions, estimates, forecasts and other views contained in this page are those of First American’s Chief Economist, do not necessarily represent the views of First American or its management, should not be construed as indicating First American’s business prospects or expected results, and are subject to change without notice. Although the First American Economics team attempts to provide reliable, useful information, it does not guarantee that the information is accurate, current or suitable for any particular purpose. © 2020 by First American. Information from this page may be used with proper attribution.


