Throughout much of 2018, home prices were high, demand was rising and bidding wars were the new normal. As a result of the competitive market, buyers were under more pressure to seek qualification for larger loans. Fraud can come in many forms, but income falsification remains one of the most likely misrepresentations. By December 2018, income-specific loan risk had increased 12 percent compared with one year ago. However, income risk has remained flat in 2019, begging the question, what drives income misrepresentation?
“In a seller’s market, there is more motivation to misrepresent income on a loan application in order to qualify for the bigger mortgage necessary to win the bidding war for a home.”
“Ability-To-Repay” Significantly Reduced Income-Related Defects
In January of 2013, the Consumer Finance Protection Bureau published new requirements for mortgage lenders to carefully assess a consumer’s ability to repay their mortgage loan, dubbed “ability-to-repay” rules. The rules were intended to discourage the use of high debt-to-income loans that were common during the housing boom. Additionally, the rules required lenders to strengthen the mortgage loan manufacturing and underwriting practices associated with the determination of a consumer’s ability to repay.
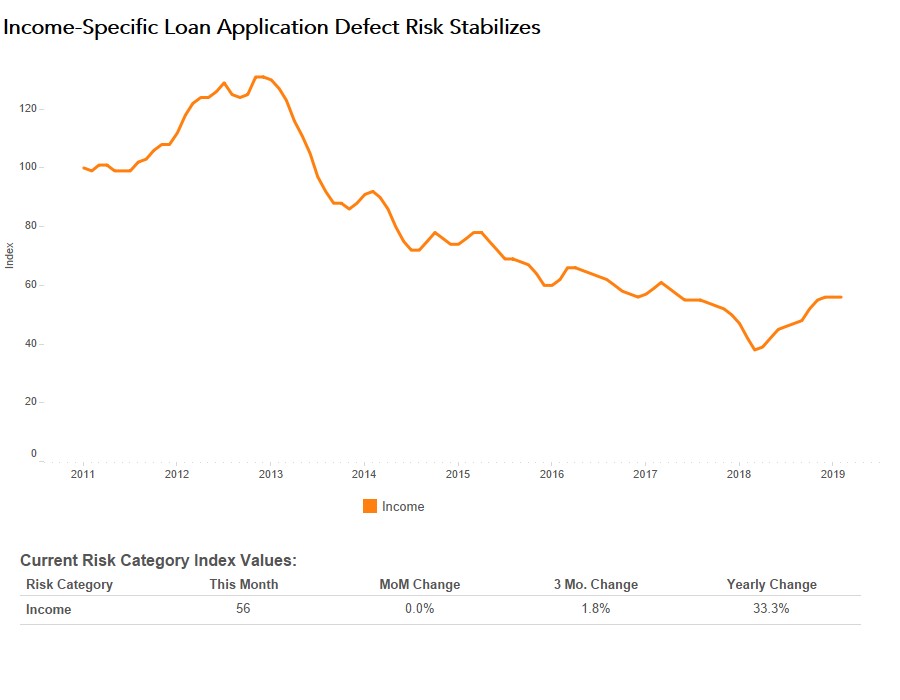
Ability-to-repay rules applied to all loans submitted on or after January 2014. One year after the implementation of the rules, the income-specific risk, as measured by the Defect Index, declined 44 percent compared with its peak, which occurred prior to the publication of the ability-to-repay rules. Since then, income-specific defect and fraud risk has remained below its peak.
Income-Specific Defects Trended Up in 2018, Plateaued in Early 2019
Income-specific defect and fraud risk had been on the rise since March 2018, however, as of this February, income-specific defect and fraud risk remains 57 percent lower than its peak in November 2012.
The shift in the mix of loan applications toward more purchase applications and pressure on borrowers likely fed the 2018 increase in income-specific defects. Between January 2018 and December 2018, interest rates increased 0.61 percentage points, while house prices continued to grow. Because of higher interest rates, refinancing activity slowed and the share of purchase loan applications compared with refinance loan applications increased. Purchase loan applications typically are more likely to have fraud than refinance transactions. Furthermore, in the strong seller’s market we experienced in 2018, borrowers had more motivation to misrepresent income on a loan application in order to qualify for the bigger mortgage necessary to win the bidding war for a home.
As the Market Cools, So Does Income-Specific Defect Risk
2018 ended the year with a decline in the 30-year, fixed-rate mortgage in December, a trend that has persisted through the first quarter of the year. Additionally, nominal house price appreciation in January sank to the slowest pace of growth since February 2015, according to the DataTree by First American House Price Index. As affordability improves and demand increases going into the spring home-buying season, we expect the seller’s market conditions to return, potentially elevating income misrepresentation risk as well.
The Defect Index is updated monthly with new data. Look for the next edition of the Defect Index the week of April 29, 2019.
Deputy Chief Economist Odeta Kushi contributed to this post.
February 2019 Loan Application Defect Index
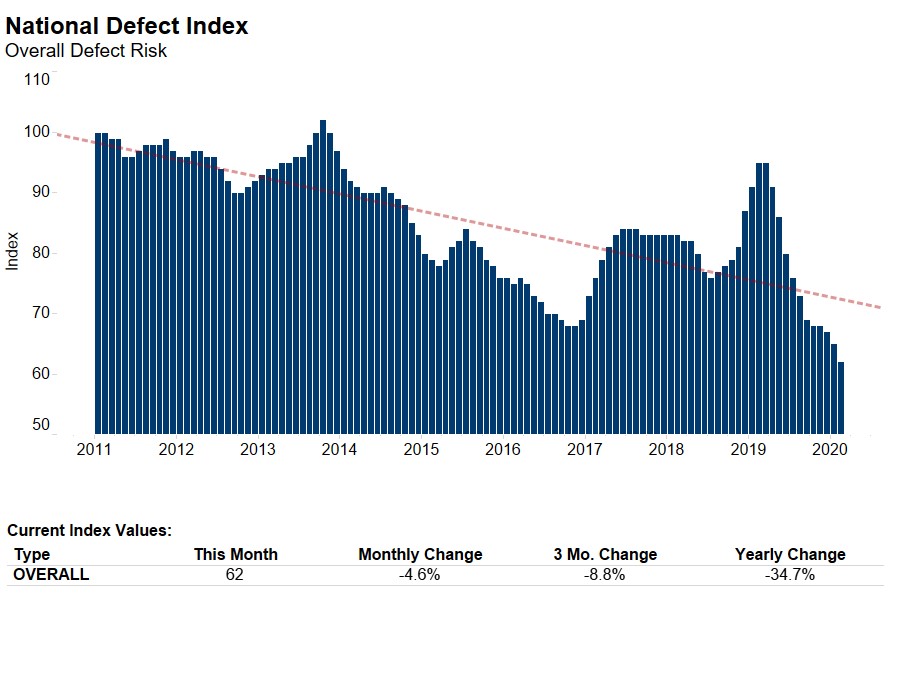
The First American Loan Application Defect Index showed that in February 2019:
- The frequency of defects, fraudulence and misrepresentation in the information submitted in mortgage loan applications increased by 4.4 percent compared with the previous month.
- Compared to February 2018, the Defect Index increased by 14.5 percent.
- The Defect Index is down 6.8 percent from the high point of risk in October 2013.
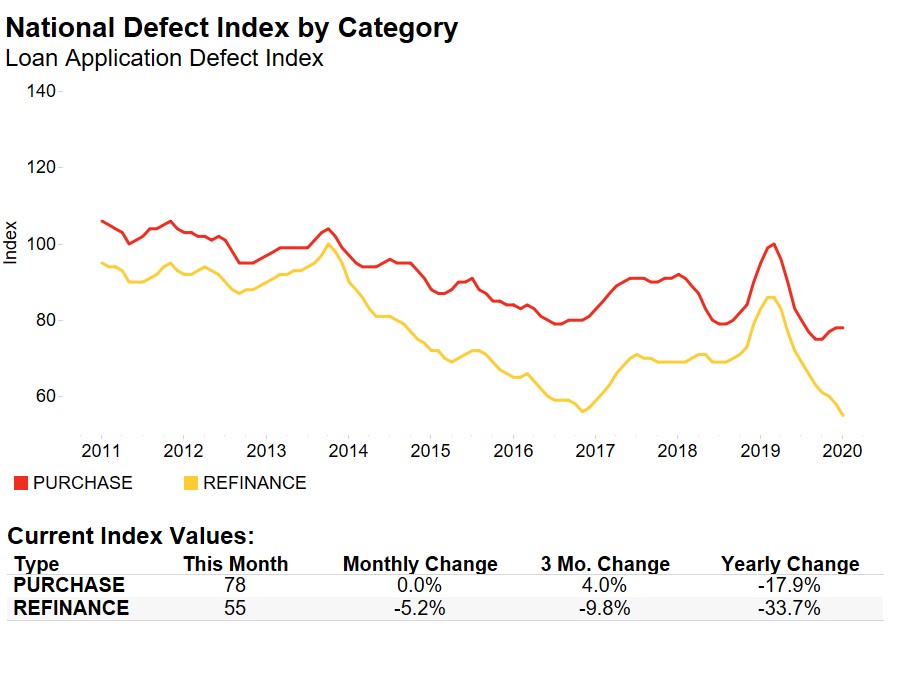
- The Defect Index for refinance transactions increased by 3.6 percent compared with the previous month, and is up 24.6 percent compared with a year ago.
- The Defect Index for purchase transactions increased by 4.2 percent compared with the previous month, and is up 8.8 percent compared with a year ago.
February 2019 State Highlights
- The five states with a year-over-year increase in defect frequency are: Maine (+42.2 percent), New York (+42.1 percent), West Virginia (+38.7 percent), Nebraska (+37.8 percent), and Iowa (+37.0 percent).
- There are two states with the year-over-year decrease in defect frequency: Arkansas (-1.9 percent) and Florida (-1.0 percent).
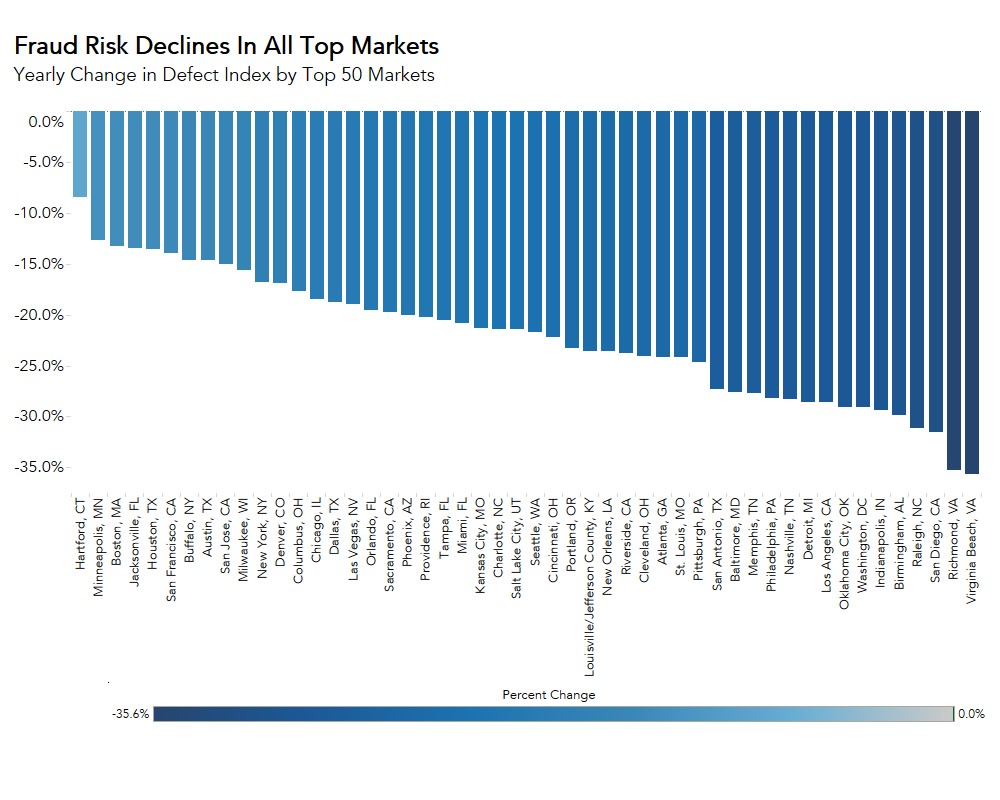
February 2019 Local Market Highlights
- Among the largest 50 Core Based Statistical Areas (CBSAs), the five markets with the greatest year-over-year increase in defect frequency are: Buffalo, N.Y. (+37.9 percent), Richmond, Va. (+36.6 percent), Pittsburgh (+32.3 percent), San Jose, Calif. (+31.9 percent), and New York, (+30.9 percent).
- Among the largest 50 Core Based Statistical Areas (CBSAs), the three markets with year-over-year decrease in defect frequency are: Jacksonville, Fla. (-11.2 percent), Houston (-8.3 percent), and Orlando, Fla. (-6.3 percent).