The Loan Application Defect Index for purchase transactions continued its downward trend, declining 3.6 percent in July compared with June, the fourth consecutive month defect risk in purchase transactions has fallen. The Defect Index for refinance transactions also fell 4.2 percent compared with the previous month. The overall Defect Index, which includes both purchase and refinance transactions, fell 5.0 percent compared with last month, and is at the same level as one year ago. Indeed, the only month the overall Defect Index has been lower was in October 2016. Before we celebrate the decline in fraud risk, it’s important to understand the underlying shifts in the mortgage market that may be driving this decline.
“As the mortgage market composition continues to shift toward refinance transactions in 2019, the risk of defect, fraud and misrepresentation will continue to decline.”
More Refinances, Less Fraud
The 30-year, fixed mortgage rate has been declining since December 2018, and in July 2019 reached 3.8 percent, the lowest rate since November 2016. As mortgage rates fall, the incentive to refinance increases. For many homeowners, the most important consideration on whether to refinance or not is if the mortgage rate is sufficiently lower than their existing rate.
The prevailing mortgage rate of 3.8 percent in July triggered a 25-percent jump in refinances month over month and a 60-percent jump compared with July 2018. Why does this matter for fraud risk? Defect, fraud and misrepresentation risk is significantly lower on refinance transactions, so the reduced risk of fraud and misrepresentation in July is largely due to the increasing share of lower risk refinance transactions within the mortgage market.
This trend has surfaced in previous refinance booms. Fraud risk reached a low point in November 2016 amid the refinance boom between the fourth quarter of 2015 and third quarter of 2016, which pushed the share of refinance originations from 46 percent to 51 percent. Similarly, in 2012, overall fraud risk declined 4.7 percent, as the mortgage rate declined from 3.9 percent to 3.6 percent between the first quarter of 2012 and fourth quarter of 2012 and the share of refinances increased from 68 percent to 72 percent. As the chart shows, trends in the overall Defect Index often coincide with shifts in refinance activity in the mortgage market.
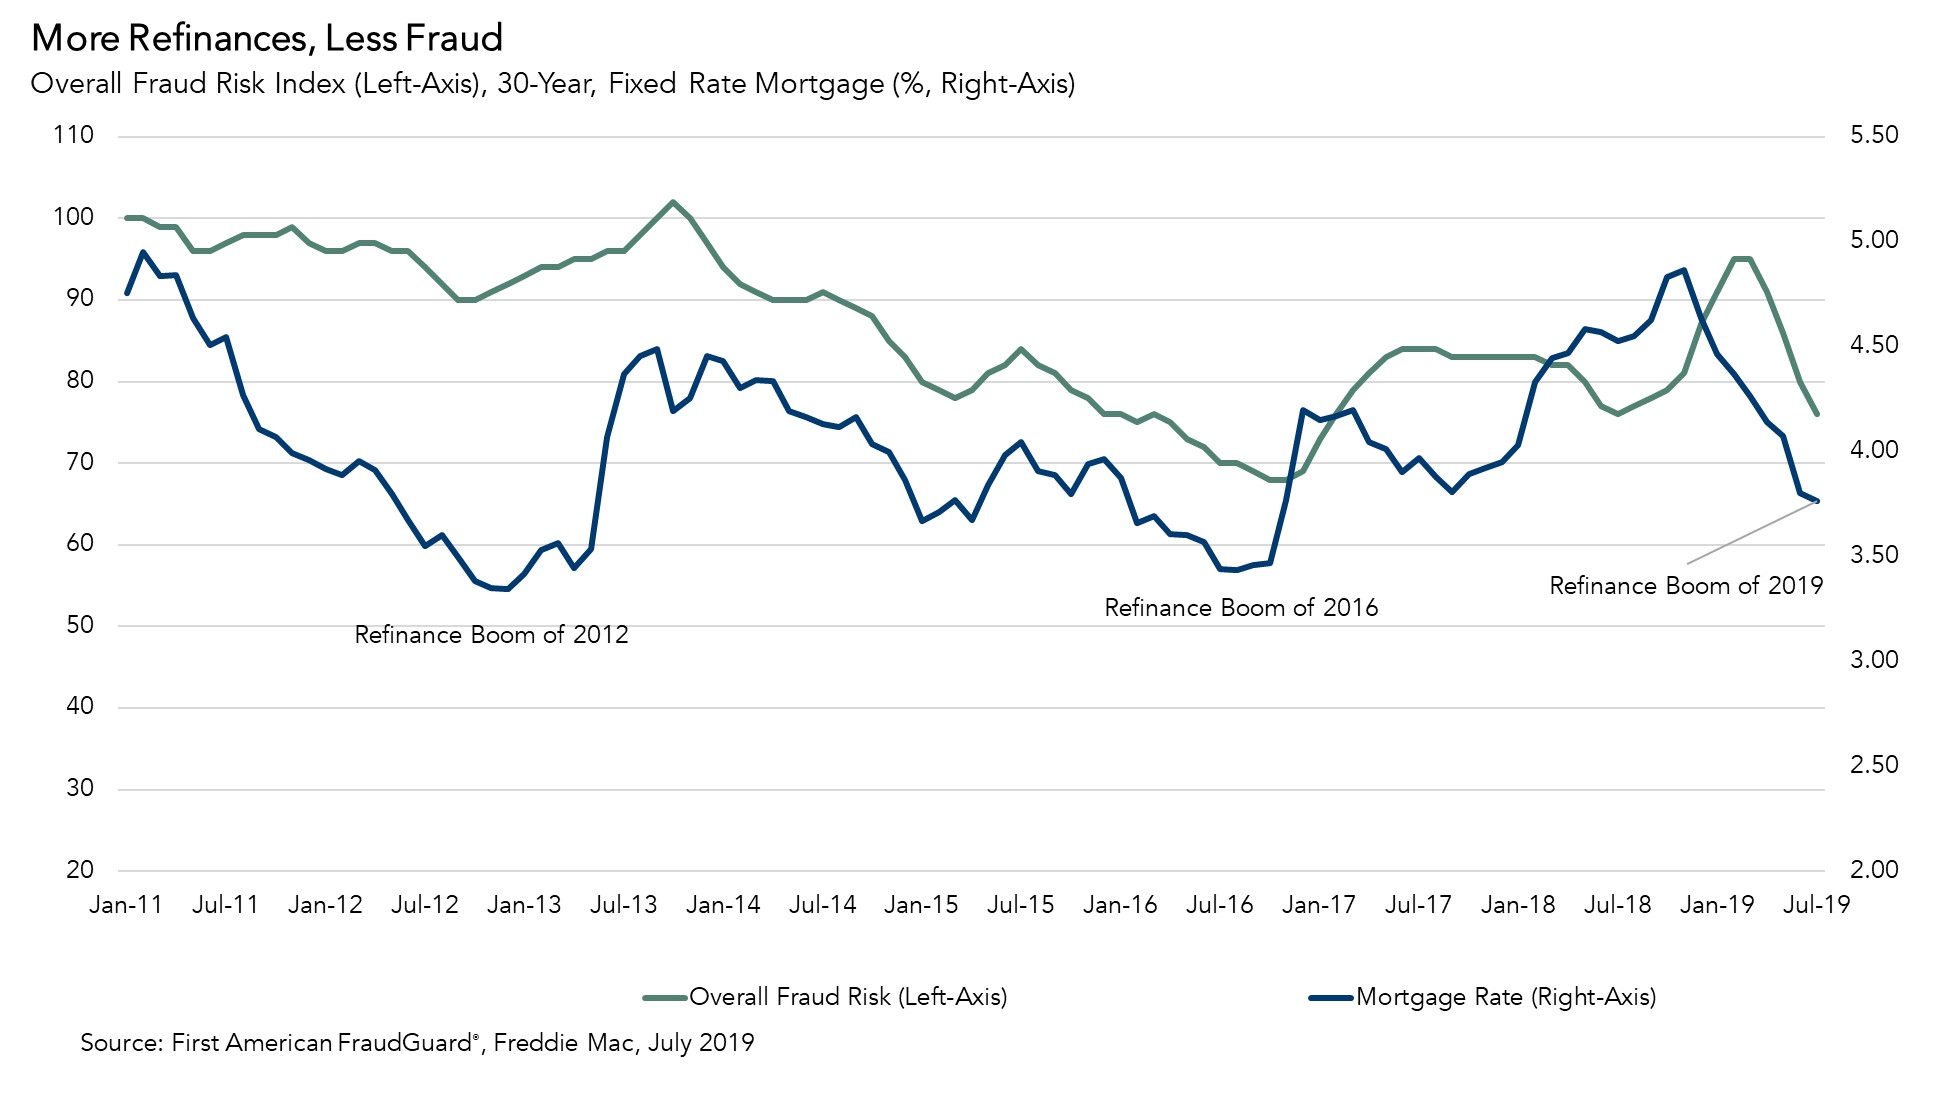
The 30-year, fixed mortgage rate continued to decline in August, which is likely to boost refinance demand even further. In fact, according to estimates, the number of existing households that would be refinance candidates would increase to 11.6 million at a mortgage rate of 3.5 percent (as the prevailing rate would be at least 0.75 percentage point lower than their current rate), compared with just 2.9 million households when the mortgage rate is 4.5 percent. As the mortgage market composition continues to shift toward refinance transactions in 2019, the risk of defect, fraud and misrepresentation will continue to decline.
For Mark’s full analysis on loan defect risk, please visit the Loan Application Defect Index.
The Defect Index is updated monthly with new data. Look for the next edition of the Defect Index the week of September 23, 2019.
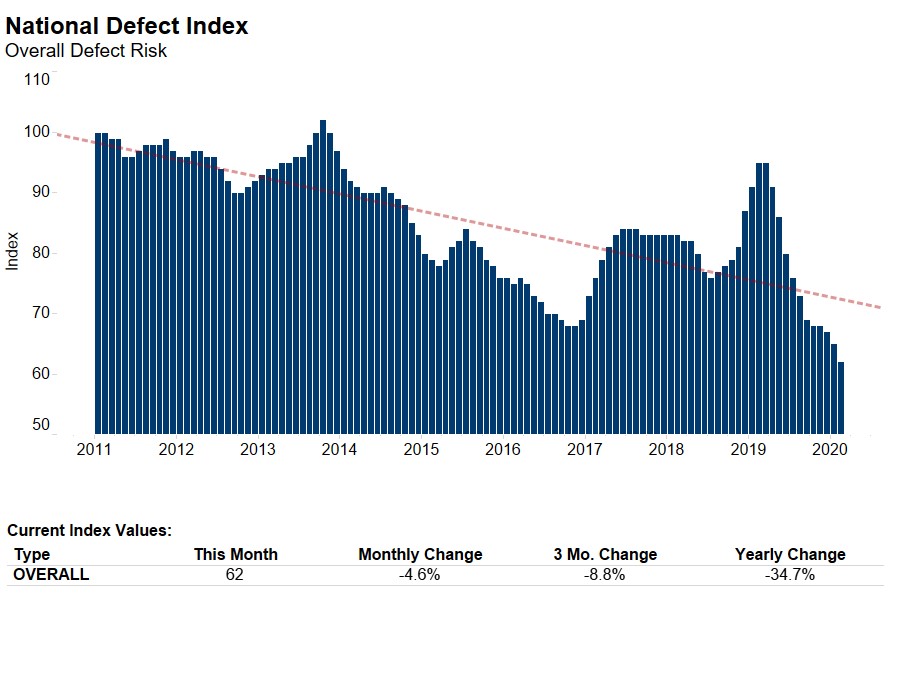
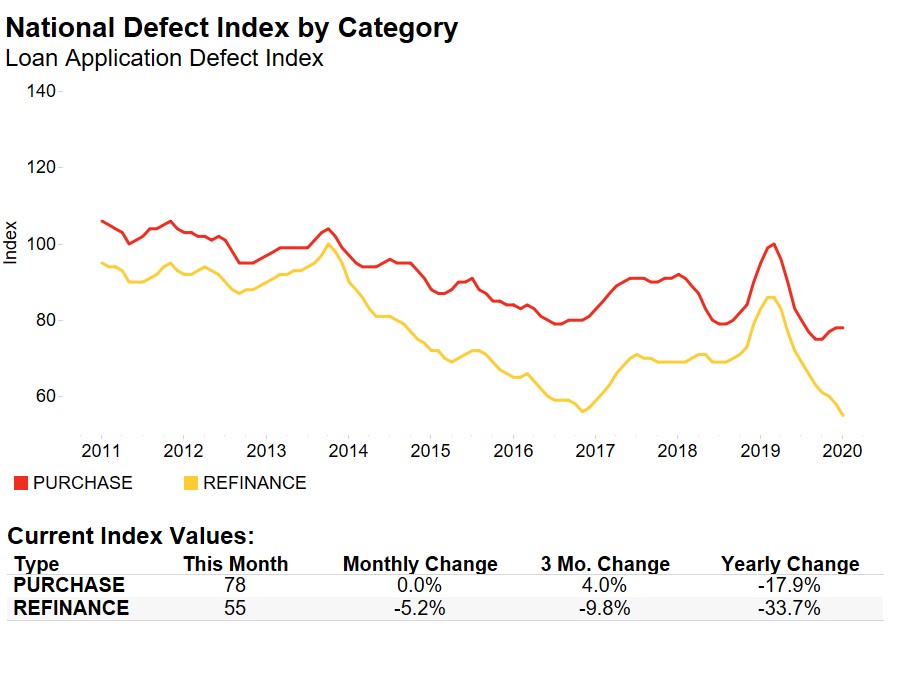
July 2019 Loan Application Defect Index
The First American Loan Application Defect Index showed that in July 2019:
- The frequency of defects, fraudulence and misrepresentation in the information submitted in mortgage loan applications decreased by 5.0 percent compared with the previous month.
- Compared to July 2018, the Defect Index remained the same.
- The Defect Index is down 25.5 percent from the high point of risk in October 2013.
- The Defect Index for refinance transactions decreased by 4.2 percent compared with the previous month, and remained the same compared with a year ago.
- The Defect Index for purchase transactions decreased by 3.6 percent compared with the previous month, and is up 1.3 percent compared with a year ago.
July 2019 State Highlights
- The five states with a year-over-year increase in defect frequency are: Nebraska (+34.8 percent), Iowa (+25.0 percent), New York (+19.7 percent), Rhode Island (+13.4 percent), and Pennsylvania (+13.3 percent).
- The five states with a year-over-year decrease in defect frequency are: Florida (-11.2 percent), Vermont (-9.9 percent), Arkansas (-7.7 percent), Arizona (-6.8 percent), and Texas (-6.3 percent).
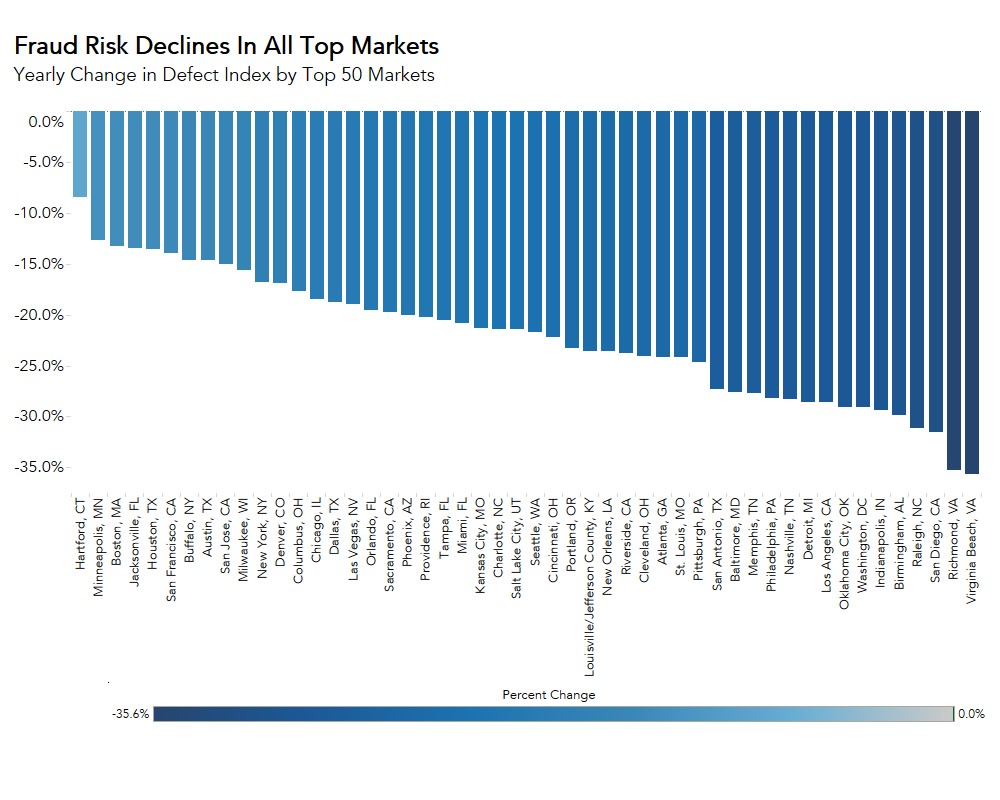
July 2019 Local Market Highlights
- Among the largest 50 Core Based Statistical Areas (CBSAs), the five markets with the greatest year-over-year increase in defect frequency are: Buffalo, N.Y. (+20.3 percent), Pittsburgh (+15.5 percent), Kansas City, Mo. (+12.5 percent), San Jose, Calif. (+11.9 percent), and New York (+11.8 percent).
- Among the largest 50 Core Based Statistical Areas (CBSAs), the three markets with year-over-year decrease in defect frequency are: Houston (-19.1 percent), Jacksonville, Fla. (-17.0 percent), Orlando, Fla. (-16.5 percent), San Diego (-16.5 percent), and Tampa, Fla. (-14.0 percent).
Methodology
The First American Loan Application Defect Index estimates the level of defects detected in the information submitted in mortgage loan applications processed by the First American FraudGuard® system. The index is based on the frequency with which defect indicators are identified. The Defect Index moves higher as greater numbers of defect indicators are identified. An increase in the index indicates a rising level of loan application defects. The index, nationally and in all markets, is benchmarked to a value of 100 in January 2011. Therefore, all index values can be interpreted as the percentage change in defect frequency relative to the defect frequency identified nationally in January 2011.