The housing market essentially reached its potential in July 2019, as actual existing-home sales were 0.05 percent above the market’s potential. Existing-home sales in 2019 are running at a pace similar to 2015, even though rates have fallen and household income has increased this year. Housing market potential benefitted from a 10.6 percent year-over-year increase in consumer house-buying power in July, as the 30-year, fixed-rate mortgage, an important component of consumer house-buying power, fell to its lowest point since November 2016.
“It’s clear that demand for existing homes is strong, but one can’t buy what’s not for sale. Declining mortgage rates could be the factor that moves the needle for those that still feel rate-locked in.”
Despite the affordability boost, the market potential for existing-home sales fell 0.3 percent this month compared with last month and dropped 1.2 percent compared with one year ago. How can the market potential fall when house-buying power remains at near-record levels? The key point to remember about the housing market is that the buyer and the seller are often one and the same household.
Forces Boosting the Potential for Existing-Home Sales
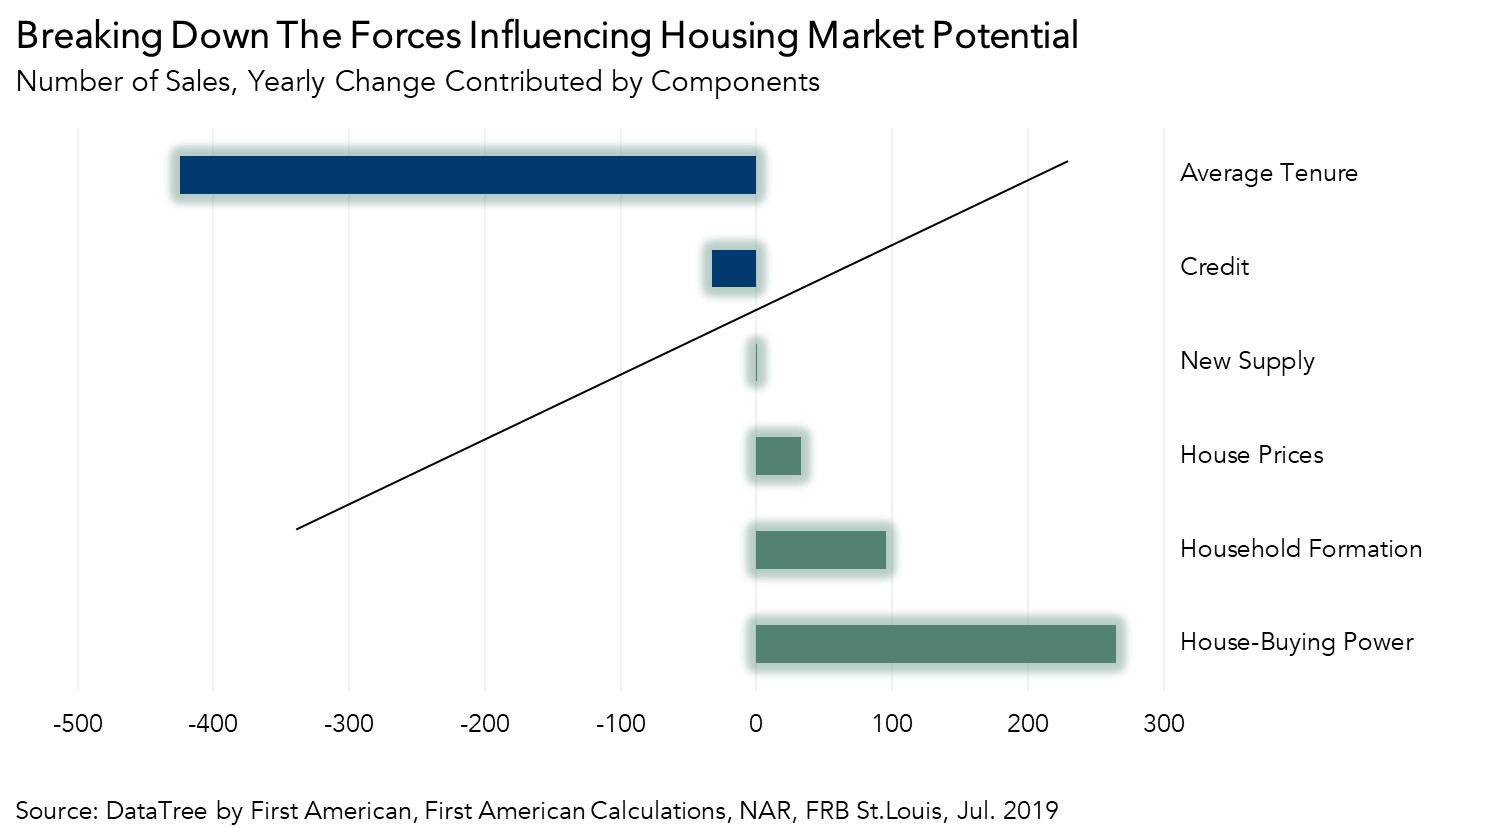
Based on our dynamic simulation Potential Home Sales Model, there are several forces shaping housing market potential today. Rising new household formation, which is an indicator of growing demand for housing, added approximately 95,000 more potential home sales compared with one year ago.
Surging house-buying power also fuels greater potential demand. House-buying power is how much home one can afford to buy given the prevailing mortgage rate and household income. Mortgage rates in July were 0.8 percentage points lower than they were a year ago, which helps increase house-buying power. Household income, the other component of consumer house-buying power, increased 2.4 percent compared with one year ago, further increasing house-buying power. The decline in the mortgage rate and income growth drove combined to increase house-buying power by $38,550 and increased market potential by 265,000 sales.
Growth in house price appreciation, albeit slower in July relative to last year, also added 33,000 more potential home sales compared with one year ago. As new supply enters the market, the risk of not being able to find something to buy lessens and homeowners’ confidence in the decision to sell their existing homes grows. New housing supply contributed 723 potential home sales compared with one year ago. In aggregate, increasing demand, rising affordability, greater equity, and new supply increased the market potential for existing-home sales by approximately 395,000 sales compared with one year ago.
A Persistent Headwind: Rising Tenure Length
While there were a flurry of forces boosting the market potential for existing-home sales in July, the low supply of homes for sale continues to hold market potential back. Existing-home sales make up approximately 90 percent of all home sales, which means existing homeowners must sell their homes in order for homes to be available for sale. Rising tenure length, therefore, means both fewer buyers and fewer homes on the market, keeping existing-home sales below potential.
Compared with one year ago, tenure length increased by 11 percent and contributed to a loss of nearly 425,000 potential home sales, more than offsetting the nearly 395,000 potential existing-home sales from the forces boosting market potential. To a lesser extent, tightening credit also contributed to a loss of 33,000 potential existing-home sales. The result? An overall decline in potential existing-home sales compared with one year ago, despite boosts in demand and affordability.
There are positive signs ahead, however. Increasing tenure length is largely the result of the rate “lock-in” effect, and seniors aging in place. In the latest Freddie Mac weekly report of mortgage rates, the 30-year, fixed mortgage rate was 3.6 percent, approaching the lowest mortgage rate in history of 3.3 percent, which occurred in 2012. Additionally, existing homeowners are sitting on $5.7 trillion of tappable equity, money which could be used to fund the purchase of a move-up home. If mortgage rates remain this low, more existing-home owners may be enticed to move. It’s clear that demand for existing homes is strong, but one can’t buy what’s not for sale. Declining mortgage rates could be the factor that moves the needle for those that still feel rate-locked in.
July 2019 Potential Home Sales
For the month of July, First American updated its proprietary Potential Home Sales Model to show that:
- Potential existing-home sales decreased marginally to a 5.18 million seasonally adjusted annualized rate (SAAR), a 0.3 percent month-over-month decrease.
- This represents a 54.4 percent increase from the market potential low point reached in February 1993.
- The market potential for existing-home sales declined by 1.2 percent compared with a year ago, a loss of 63,000 (SAAR) sales.
- Currently, potential existing-home sales is 1.54 million (SAAR), or 22.9 percent below the pre-recession peak of market potential, which occurred in March 2004.
Market Performance Gap
- The market for existing-home sales is marginally overperforming its potential by 0.05 percent or an estimated 2,740 (SAAR) sales.
- The market performance gap decreased by an estimated 54,600 (SAAR) sales between June 2019 and July 2019.
First American Deputy Chief Economist Odeta Kushi contributed to this post.
What Insight Does the Potential Home Sales Model Reveal?
When considering the right time to buy or sell a home, an important factor in the decision should be the market’s overall health, which is largely a function of supply and demand. Knowing how close the market is to a healthy level of activity can help consumers determine if it is a good time to buy or sell, and what might happen to the market in the future. That is difficult to assess when looking at the number of homes sold at a particular point in time without understanding the health of the market at that time. Historical context is critically important. Our potential home sales model measures what we believe a healthy market level of home sales should be based on the economic, demographic and housing market environments.
About the Potential Home Sales Model
Potential home sales measures existing-homes sales, which include single-family homes, townhomes, condominiums and co-ops on a seasonally adjusted annualized rate based on the historical relationship between existing-home sales and U.S. population demographic data, homeowner tenure, house-buying power in the U.S. economy, price trends in the U.S. housing market, and conditions in the financial market. When the actual level of existing-home sales are significantly above potential home sales, the pace of turnover is not supported by market fundamentals and there is an increased likelihood of a market correction. Conversely, seasonally adjusted, annualized rates of actual existing-home sales below the level of potential existing-home sales indicate market turnover is underperforming the rate fundamentally supported by the current conditions. Actual seasonally adjusted annualized existing-home sales may exceed or fall short of the potential rate of sales for a variety of reasons, including non-traditional market conditions, policy constraints and market participant behavior. Recent potential home sale estimates are subject to revision to reflect the most up-to-date information available on the economy, housing market and financial conditions. The Potential Home Sales model is published prior to the National Association of Realtors’ Existing-Home Sales report each month.

.jpg)
