In November, the housing market underperformed its potential by 7.4 percent, marking 40 straight months the market remained below its potential, according to our Potential Homes Sales Model. Month over month, the gap between actual existing-home sales and the market potential for home sales narrowed by 1.2 percent, but the housing market still has the potential to support more than 457,000 additional home sales at a seasonally adjusted annualized rate (SAAR).
“Changing mortgage rates don’t change the other fundamentals – a thriving economy and rising millennial home buyer demand continue to underpin today’s housing market.”
Home Sales Decline, But Prices Rise?
While existing-home sales underperformed potential throughout 2018, house price appreciation has continued to make significant gains this year. Why are home sales declining, but house prices rising? This may be counter-intuitive to some, but declining home sales and rising house prices is not a surprising phenomenon because mortgage rates have been rising. The Fed has been raising rates for almost two years after a long stretch where monetary policy was geared to keep rates near historic lows.
Higher mortgage rates impact both housing supply and demand. Current homeowners and prospective home buyers alike are experiencing a 30-year, fixed-rate mortgage close to 5 percent for the first time in eight years. Higher mortgage rates reduce affordability for the first-time home buyer, constricting demand. But, higher mortgage rates also create a financial disincentive for existing homeowners with low rates on their existing mortgages from selling their homes, thus limiting supply. Existing-home sellers are also home buyers, so the financial disincentive from higher mortgage rates impacts both sides of the supply and demand dynamic.
What Can We Learn From Previous Rising-Rate Eras?
Yet, existing-home sales don’t always slow down when mortgage rates rise. Existing-home sales trends are often more influenced by why mortgage rates are rising. Looking back over the last 25 years, there have been seven significant rising mortgage rate eras. We’ve charted the change in existing-home sales in each of these eras in the figure below.
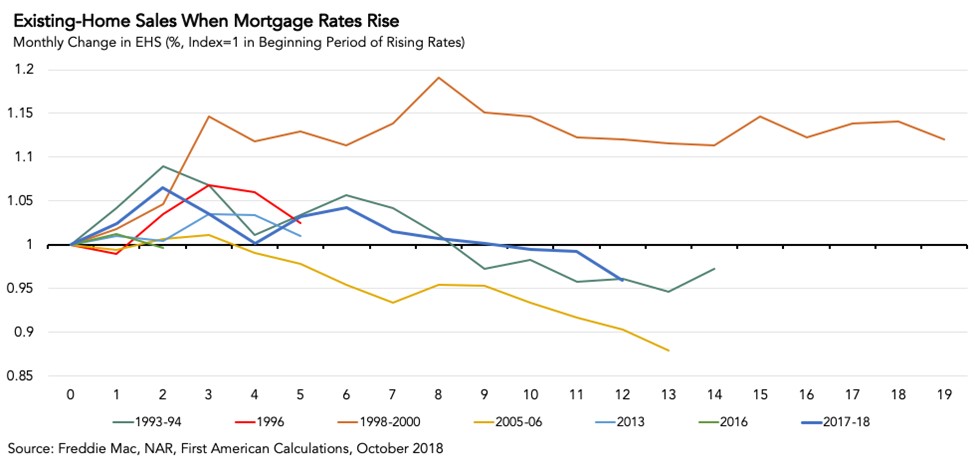
There are two examples where rising mortgage rates led to declining existing-home sales. From late 1993 to the end of 1994, the Fed increased the benchmark federal funds rate to manage inflation. The increase caused mortgage rates to jump to more than 9 percent. While it took eight months before there were any negative consequences to existing-home sales, they eventually declined by approximately 5 percent.
The largest decline was between 2005 and 2006. Rising mortgage rates in that period were driven by the Fed’s efforts to cool the over-heated housing market and tame above-target inflation. The Fed’s moves worked, as existing-home sales declined by more than 10 percent over the course of a year.
However, other than these two examples and the most recent increase in mortgage rates, existing-home sales have shown to be relatively resistant to rising-rate environments. For example, mortgage rates spiked in the summer of 2013 when the Federal Reserve indicated it would taper its quantitative easing policy of buying Treasury bonds and mortgage-backed securities. But, this ‘taper tantrum’ had no negative impact on existing-home sales.
It appears that the duration of the rising-rate era is important. The longer the rising-rate era lasts, the more likely there will be a decline in existing-home sales. Today, as mortgage rates have increased, existing-home sales have fallen. But, this time, the unwillingness of existing homeowners to sell as mortgage rates have increased is driving the decline in existing-home sales.
Strong Economy, Millennial Demand Mitigate Rising Mortgage Rates
While rising mortgage rates may be indirectly responsible for today’s shortage of housing, they have not always meant a decrease in existing-home sales. Each rising rate environment is different and driven by various economic events and conditions. Additionally, changing mortgage rates don’t change the other fundamentals -- a thriving economy and rising millennial home buyer demand continue to underpin today’s housing market.
November 2018 Potential Home Sales
For the month of November, First American updated its proprietary Potential Home Sales Model to show that:
- Potential existing-home sales increased to a 6.2 million seasonally adjusted annualized rate (SAAR), a 1.0 percent month-over-month increase.
- This represents a 63.0 percent increase from the market potential low point reached in February 2011.
- The market potential for existing-home sales increased by 1.8 percent compared with a year ago, a gain of 109,000 (SAAR) sales.
- Currently, potential existing-home sales is 1.1 million (SAAR), or 15.0 percent below the pre-recession peak of market potential, which occurred in July 2005.
Market Performance Gap
- The market for existing-home sales is underperforming its potential by 7.4 percent or an estimated 457,000 (SAAR) sales.
- The market performance gap decreased by an estimated 66,000 (SAAR) sales between October 2018 and November 2018.
What Insight Does the Potential Home Sales Model Reveal?
When considering the right time to buy or sell a home, an important factor in the decision should be the market’s overall health, which is largely a function of supply and demand. Knowing how close the market is to a healthy level of activity can help consumers determine if it is a good time to buy or sell, and what might happen to the market in the future. That is difficult to assess when looking at the number of homes sold at a particular point in time without understanding the health of the market at that time. Historical context is critically important. Our potential home sales model measures what we believe a healthy market level of home sales should be based on the economic, demographic and housing market environments.
About the Potential Home Sales Model
Potential home sales measures existing-homes sales, which include single-family homes, townhomes, condominiums and co-ops on a seasonally adjusted annualized rate based on the historical relationship between existing-home sales and U.S. population demographic data, income and labor market conditions in the U.S. economy, price trends in the U.S. housing market, and conditions in the financial market. When the actual level of existing-home sales are significantly above potential home sales, the pace of turnover is not supported by market fundamentals and there is an increased likelihood of a market correction. Conversely, seasonally adjusted, annualized rates of actual existing-home sales below the level of potential existing-home sales indicate market turnover is underperforming the rate fundamentally supported by the current conditions. Actual seasonally adjusted annualized existing-home sales may exceed or fall short of the potential rate of sales for a variety of reasons, including non-traditional market conditions, policy constraints and market participant behavior. Recent potential home sale estimates are subject to revision in order to reflect the most up-to-date information available on the economy, housing market and financial conditions. The Potential Home Sales model is published prior to the National Association of Realtors’ Existing-Home Sales report each month.

.jpg)
