In March 2022, the Real House Price Index (RHPI) increased 32.5 percent year over year, which is the fastest growth in the more than 30-year history of the series. This rapid annual decline in affordability was driven by two factors: a 21.6 percent annual increase in nominal house prices and over a full percentage point increase in the 30-year, fixed mortgage rate compared with one year ago. Even though household income increased 4.9 percent since March 2021 and boosted consumer house-buying power, it was not enough to offset the affordability loss from higher mortgage rates and fast-rising nominal prices.
"History has shown that rising mortgage rates may take the steam out of rising house prices, but they don’t necessarily trigger a decline.”
Reduced affordability prompts some buyers to pull back from the market and sellers to adjust their price expectations. The housing market is slowing down by design as the Federal Reserve tightens monetary policy in order to tame inflation. Early data signals the housing market is normalizing -- our preliminary nominal house price index for the months of April and May indicates annual house price growth is decelerating. Historical data provides helpful perspective on how house prices react to rising mortgage rates.
Do Rising Mortgage Rates Always Slow Nominal House Price Appreciation?
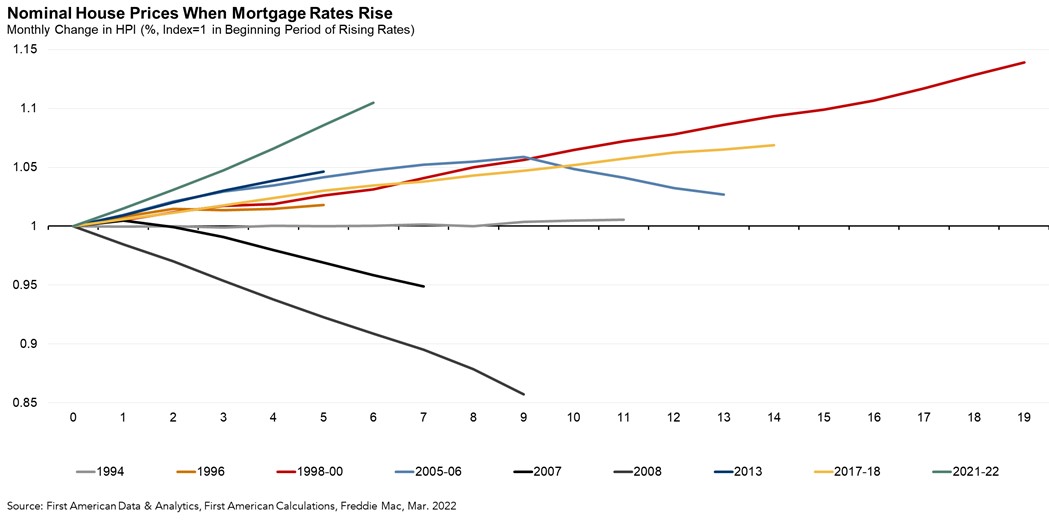
Rising mortgage rates and declining affordability have been two of the defining trends of the 2022 housing market. However, mortgage rates and their effect on home prices may not be as straightforward as many think. The graph below shows unadjusted house prices in nine rising mortgage rate eras over the past 28 years. More often than not, house price appreciation has been resistant to rising mortgage rates. One exception is the 1994 rising-rate era, when house prices declined slightly and briefly. Another exception is the 2005-2006 period, otherwise known as the U.S. housing bubble, when house prices peaked in early 2006 and started to decline through 2006 and 2007. The rising rate periods during the housing bust of 2008 and 2009 is another key exception.
In the longest rising mortgage rate era, 1998-2000, nominal house prices remained elevated as the economy continued to recover from the previous recession. This period was defined by tight labor markets, low inflation, and a higher minimum wage - all contributing to a healthy housing market. In just over a year and a half, house prices increased nearly 14 percent during this era. In the most recent rising mortgage rate era from 2017 through 2018, nominal house prices increased approximately 7 percent over a 15-week period.
Supply-Demand Imbalance Keeping the Pressure On
The lesson? House prices don’t fall just because mortgage rates rise. Rising mortgage rates do influence house prices, but broader economic conditions are often more influential. The Federal Reserve is purposely trying to slow the housing market in order to tame inflation, and early indications, based on our preliminary house price index, signal a normalizing housing market. History has shown that rising mortgage rates may take the steam out of rising house prices, but they don’t necessarily trigger a decline. In today’s housing market, demand for homes continues to outpace supply, which is keeping the pressure on house prices, so don’t expect house prices to decline.
For more analysis of affordability, please visit the Real House Price Index. The RHPI is updated monthly with new data. Look for the next edition of the RHPI the week of June 27, 2022.
Sources:
March 2022 Real House Price Index Highlights
The First American Real House Price Index (RHPI) showed that in March 2022:
- Real house prices increased 6.7 percent between February 2022 and March 2022.
- Real house prices increased 32.5 percent between March 2021 and March 2022.
- Consumer house-buying power, how much one can buy based on changes in income and interest rates, decreased 4.6 percent between February 2022 and March 2022, and decreased 8.3 percent year over year.
- Median household income has increased 4.9 percent since March 2021 and 70.8 percent since January 2000.
- Real house prices are 12.0 percent more expensive than in January 2000.
- While unadjusted house prices are now 50.8 percent above the housing boom peak in 2006, real, house-buying power-adjusted house prices remain 21.1 percent below their 2006 housing boom peak.
March 2022 Real House Price State Highlights
- The five states with the greatest year-over-year increase in the RHPI are: Florida (+46.7 percent), South Carolina (+46.1 percent), Georgia (+40.5 percent), Arizona (+39.7 percent), and Idaho (+37.7 percent).
- There were no states with a year-over-year decrease in the RHPI.
March 2022 Real House Price Local Market Highlights
- Among the Core Based Statistical Areas (CBSAs) tracked by First American, the five markets with the greatest year-over-year increase in the RHPI are: Charlotte, N.C. (+46.6 percent), Raleigh, N.C. (+43.5 percent), Tampa, Fla. (+43.3 percent), Phoenix (+42.0 percent), and Jacksonville, Fla. (+41.2 percent).
- Among the Core Based Statistical Areas (CBSAs) tracked by First American, there were no markets with a year-over-year decrease in the RHPI.
About the First American Real House Price Index
The traditional perspective on house prices is fixated on the actual prices and the changes in those prices, which overlooks what matters to potential buyers - their purchasing power, or how much they can afford to buy. First American’s proprietary Real House Price Index (RHPI) adjusts prices for purchasing power by considering how income levels and interest rates influence the amount one can borrow.
The RHPI uses a weighted repeat-sales house price index that measures the price movements of single-family residential properties by time and across geographies, adjusted for the influence of income and interest rate changes on consumer house-buying power. The index is set to equal 100 in January 2000. Changing incomes and interest rates either increase or decrease consumer house-buying power. When incomes rise and mortgage rates fall, consumer house-buying power increases, acting as a deflator of increases in the house price level. For example, if the house price index increases by three percent, but the combination of rising incomes and falling mortgage rates increase consumer buying power over the same period by two percent, then the Real House Price index only increases by 1 percent. The Real House Price Index reflects changes in house prices, but also accounts for changes in consumer house-buying power.
Disclaimer
Opinions, estimates, forecasts and other views contained in this page are those of First American’s Chief Economist, do not necessarily represent the views of First American or its management, should not be construed as indicating First American’s business prospects or expected results, and are subject to change without notice. Although the First American Economics team attempts to provide reliable, useful information, it does not guarantee that the information is accurate, current or suitable for any particular purpose. © 2022 by First American. Information from this page may be used with proper attribution.


