Once again, home buyers benefitted from a year-over-year affordability boost as two of the three key drivers of the Real House Price Index (RHPI), household income and mortgage rates, swung in favor of increased affordability in November. Compared with November 2018, the 30-year, fixed-rate mortgage fell by 1.2 percentage points and household income increased 2.6 percent. Both trends, rising household income and declining mortgage rates, boost consumer house-buying power.
“So far, rising house-buying power has been strong enough to overcome the pace of nominal house price appreciation nationally and in all top markets relative to last year, but that could change.”
However, increased house-buying power also drives demand, and rising demand in a supply constrained market results in faster nominal house price appreciation. This is exactly what occurred in November, as the final component of the RHPI, nominal house prices, continued to accelerate, offsetting some of the affordability tailwind from rising house-buying power.
Even as nominal house prices have gained momentum because of the supply and demand imbalance, real house prices actually declined by 8.1 percent thanks to the benefit of increased buying power. Since we know real estate is local, house-buying power and nominal house price gains vary by city, begging the question, where did affordability increase the most?
The Five Cities Where Affordability Increased the Most
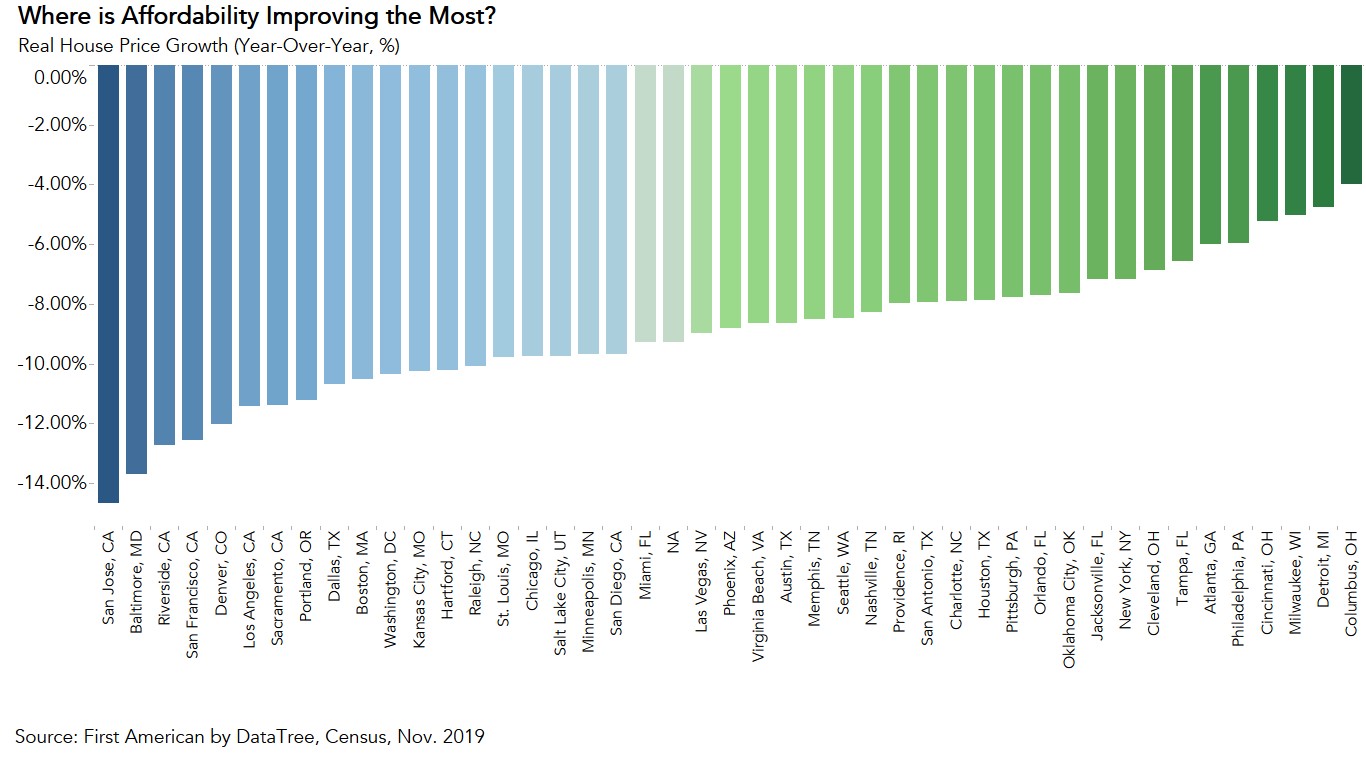
Affordability improved year over year in each of the 44 markets we track. The five markets with the greatest year-over-year growth in affordability were:
1.) San Jose, Calif.
2.) Baltimore
3.) Riverside, Calif.
4.) San Francisco
5.) Denver
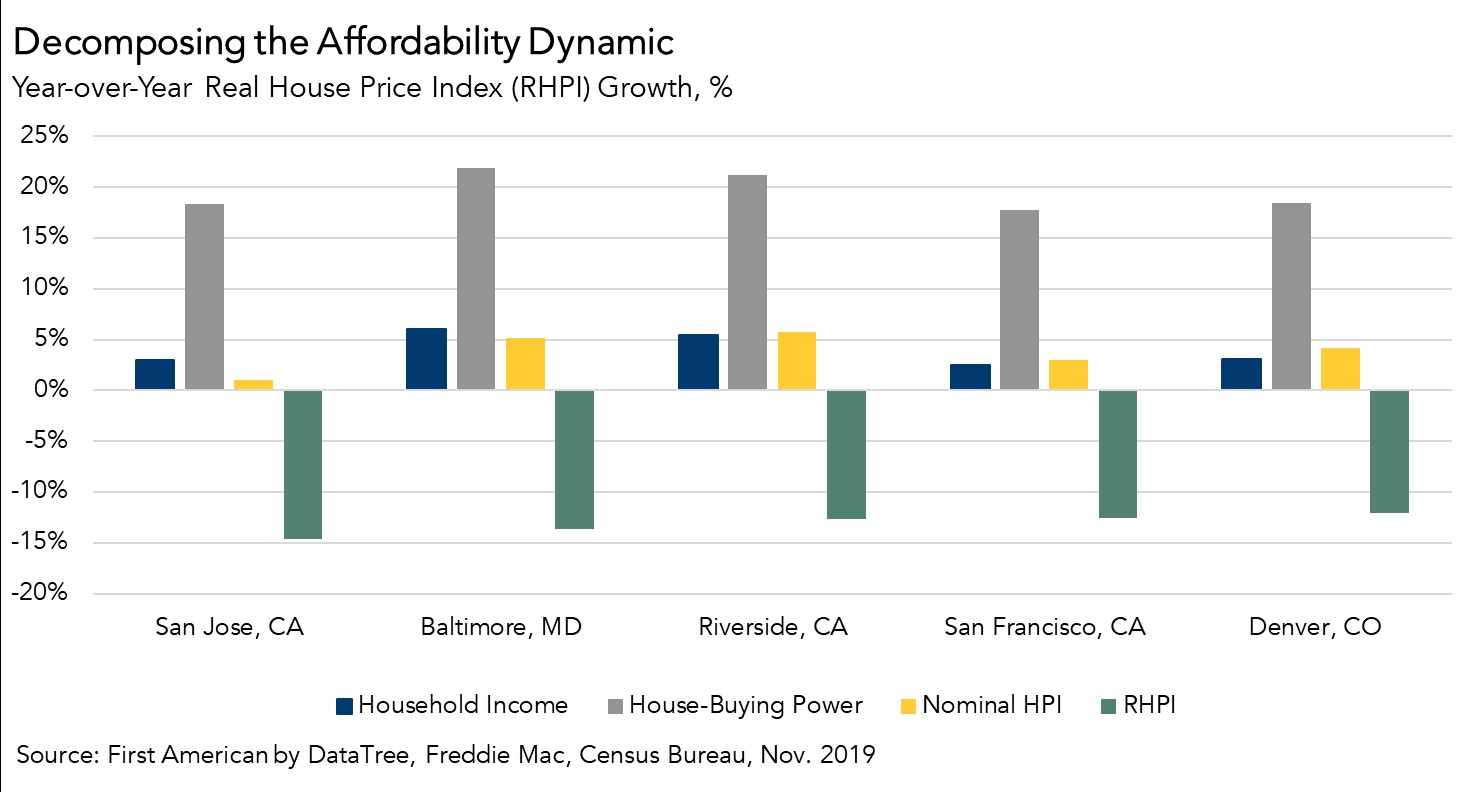
Declining mortgage rates increase affordability equally in each market, as mortgage rates are generally the same across the country. However, household income growth and nominal house prices vary by market, so the affordability dynamic varies as well. In November, San Jose had the greatest year-over-year increase in affordability, mostly due to slower nominal house price appreciation compared with the other markets. Baltimore had slightly higher nominal house price appreciation compared with Riverside, 5.2 percent and 5.8 percent respectively, but outpaced Riverside when it came to house-buying power, growing by 22 percent versus Riverside’s 21 percent.
Finally, the intricate dance between house-buying power and nominal house price appreciation becomes clear when comparing the cities taking the final top spots: San Francisco and Denver. The improvement in affordability in San Francisco was slightly greater than Denver due to slower nominal house price appreciation (3.0 percent versus Denver’s 4.2 percent), even though house-buying power in Denver outpaced San Francisco by 0.6 percentage points.
Increased Affordability Drives Demand
Nominal house price indices overlook what matters most to potential buyers – their purchasing power, or how much they can afford to buy. Rising house-buying power due to lower mortgage rates and strong income growth boosts affordability and drives demand. However, when demand increases for a scarce good, such as housing, prices will rise faster.
The net effect of these dynamics will determine the trend in affordability in 2020, and thereby impact home-buyer demand. So far, rising house-buying power has been strong enough to overcome the pace of nominal house price appreciation nationally and in all top markets relative to last year, but that could change.
For more analysis of affordability, please visit the Real House Price Index.
The RHPI is updated monthly with new data. Look for the next edition of the RHPI the week of February 24, 2020.
Sources:
November 2019 Real House Price Index Highlights
The First American Real House Price Index (RHPI) showed that in November 2019:
- Real house prices increased 1.2 percent between October 2019 and November 2019.
- Real house prices declined 8.1 percent between November 2018 and November 2019.
- Consumer house-buying power, how much one can buy based on changes in income and interest rates, increased 0.2 percent between October 2019 and November 2019, and increased 17.9 percent year over year.
- Median household income has increased 2.6 percent since November 2018 and 58.1 percent since January 2000.
- Real house prices are 16.7 percent less expensive than in January 2000.
- While unadjusted house prices are now 10.0 percent above the housing boom peak in 2006, real, house-buying power-adjusted house prices remain 40.7 percent below their 2006 housing boom peak.
November Real House Price State Highlights
- There are no states with a year-over-year increase in the RHPI.
- The five states with the greatest year-over-year decrease in the RHPI are: New Mexico (-12.9 percent), California (-12.2 percent), Utah (-11.9 percent), Nebraska (-11.5 percent), and Mississippi (-11.4 percent).
November 2019 Real House Price Local Market Highlights
- Among the Core Based Statistical Areas (CBSAs) tracked by First American, there are no markets with a year-over-year increase in the RHPI.
- Among the Core Based Statistical Areas (CBSAs) tracked by First American, the five markets with the greatest year-over-year decrease in the RHPI are: San Jose, Calif. (-14.7 percent), Baltimore (-13.7 percent), Riverside, Calif. (-12.7 percent), San Francisco (-12.6 percent), and Denver (-12.0 percent).
About the First American Real House Price Index
The traditional perspective on house prices is fixated on the actual prices and the changes in those prices, which overlooks what matters to potential buyers - their purchasing power, or how much they can afford to buy. First American’s proprietary Real House Price Index (RHPI) adjusts prices for purchasing power by considering how income levels and interest rates influence the amount one can borrow.
The RHPI uses a weighted repeat-sales house price index that measures the price movements of single-family residential properties by time and across geographies, adjusted for the influence of income and interest rate changes on consumer house-buying power. The index is set to equal 100 in January 2000. Changing incomes and interest rates either increase or decrease consumer house-buying power. When incomes rise and mortgage rates fall, consumer house-buying power increases, acting as a deflator of increases in the house price level. For example, if the house price index increases by three percent, but the combination of rising incomes and falling mortgage rates increase consumer buying power over the same period by two percent, then the Real House Price index only increases by 1 percent. The Real House Price Index reflects changes in house prices, but also accounts for changes in consumer house-buying power.
Disclaimer
Opinions, estimates, forecasts and other views contained in this page are those of First American’s Chief Economist, do not necessarily represent the views of First American or its management, should not be construed as indicating First American’s business prospects or expected results, and are subject to change without notice. Although the First American Economics team attempts to provide reliable, useful information, it does not guarantee that the information is accurate, current or suitable for any particular purpose. © 2020 by First American. Information from this page may be used with proper attribution.


