
Key Points:
- Only 26 percent of homes were affordable to the median renter nationally in Q2 2025, down from 28 percent at the end of 2024.
- The AFC South leads the 2025 Affordability Bowl standings, with Jacksonville and Indianapolis offering the most accessible housing markets.
- With mortgage rates easing, incomes rising, and price growth slowing, affordability could improve in the second half of the year – just in time for the NFL playoffs.
For many renters hoping to become first-time buyers, today’s housing market can feel like 4th-and-long. According to our First-Time Home Buyer Outlook Report, the median renter—who can also be considered the median first-time home buyer—could only afford 26 percent of homes for sale nationally in the second quarter of 2025, down from 28 percent in the last quarter of 2024. But just like in the NFL, where every division has its own strengths and weaknesses, affordability varies widely across the country. When we breakdown the affordability game film, it’s clear that some divisions are marching down the field with strong affordability stats, while others struggle to get past the line of scrimmage.
“Affordability may still be stuck deep in its own territory, but the field is shifting, and first-time buyers could soon be back in scoring position.”
Who’s Winning the 2025 Affordability Bowl?
For potential first-time home buyers, who by definition are renters, affordability is a function of their house-buying power and the corresponding share of homes for sale that are within their reach. In our analysis, a potential first-time home buyer’s house-buying power – how much home they can afford – is based on the renter’s household income, the prevailing 30-year, fixed mortgage rate, and the assumption that one-third of pre-tax income is used for a mortgage with a 5 percent down payment. The share of homes for sale that are affordable to the median renter in any given market is then estimated by comparing home sale transactions from First American Data & Analytics to the median renter’s house-buying power.
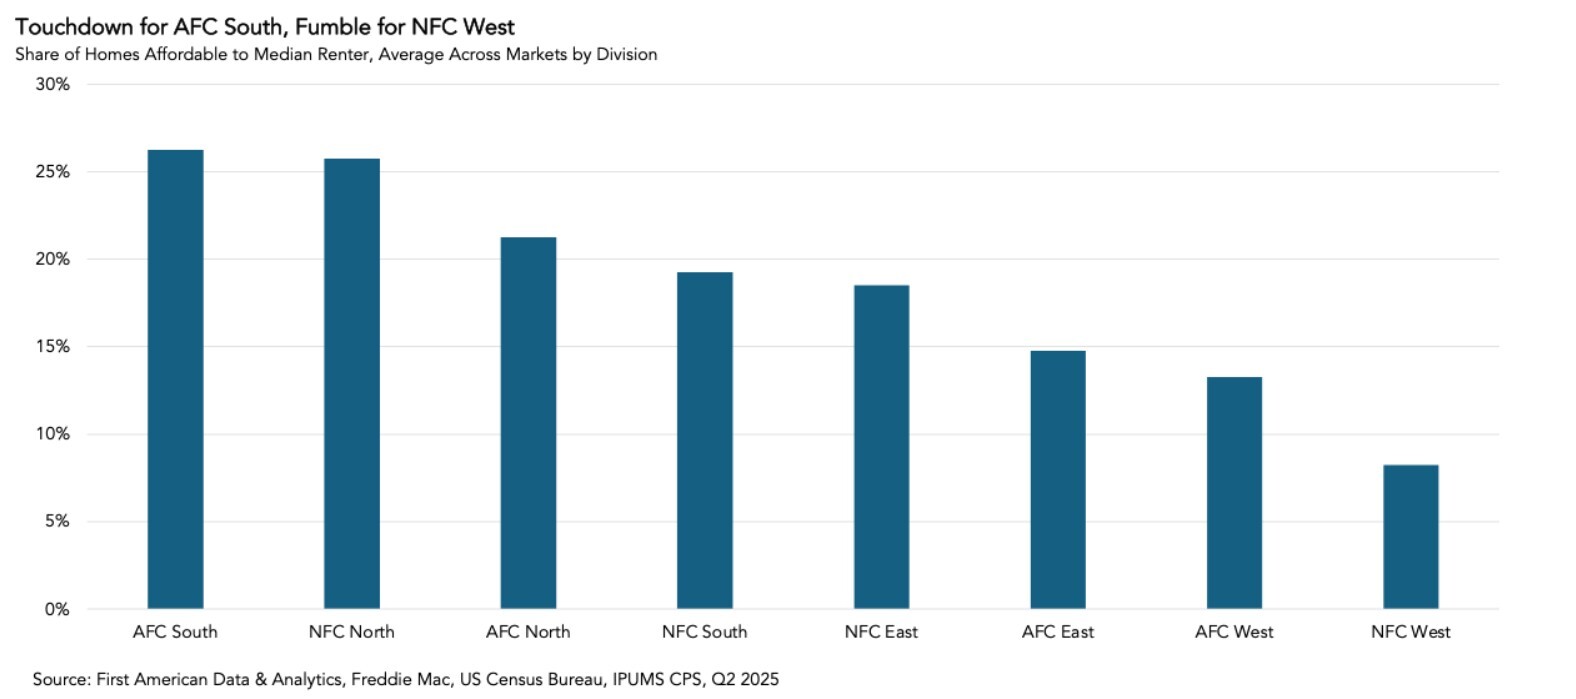
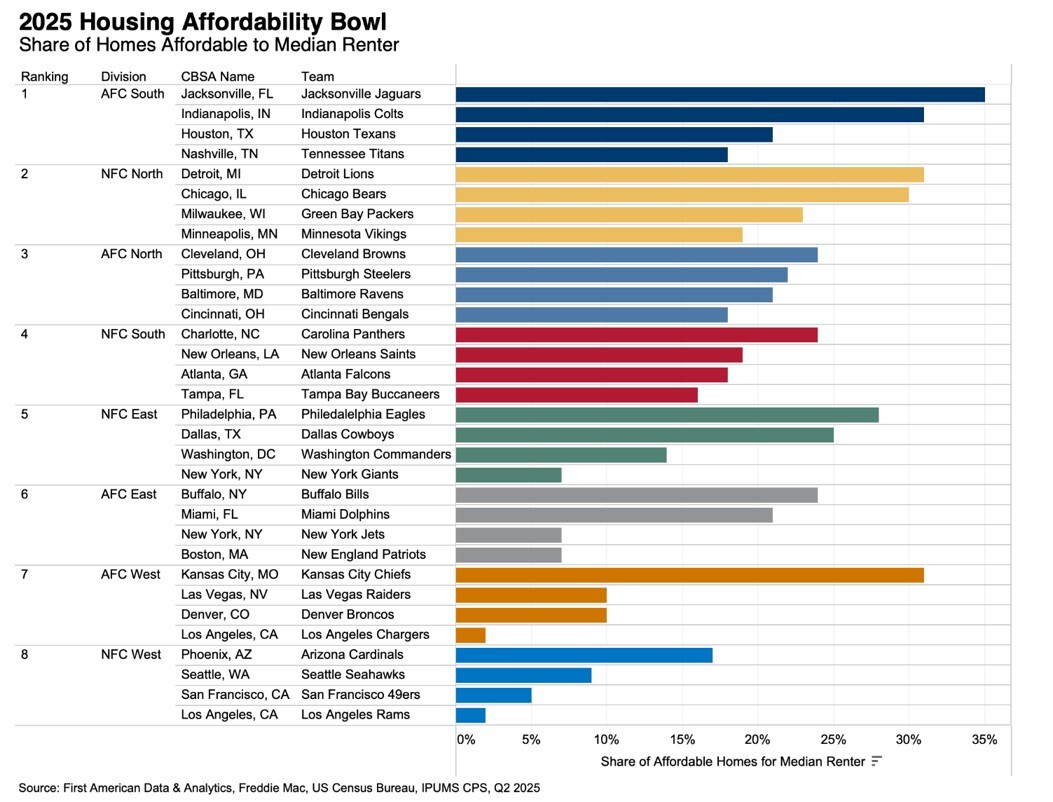
When we compare affordability by NFL division, the AFC South takes the top spot, averaging about 26 percent of homes affordable to the median renter. For example, Jacksonville leads the drive with 35 percent of homes affordable to the median renter, a median home price of $343,900, and a median renter income of about $65,700. Indianapolis isn’t far behind, with 31 percent affordability, a median home price of $311,220, and median renter household income near $55,700.
The NFC North comes in second, thanks to markets like Detroit, where the median renter can afford 31 percent of the homes for sale, a median home price of $260,000, and the median renter household income is about $43,500. Chicago also pads the division’s stats, with 30 percent affordability, a median home price of $350,000, and median renter household income of $62,400.
On the other end of the field, the NFC West gets sacked for low affordability, with an average of just 8 percent of homes affordable to the median renter. In San Francisco, the median renter earns approximately $94,700, but with a median home price of $1.18 million, only 5 percent of homes are within reach. Los Angeles fares even worse, with just 2 percent affordability, given the median renter household income of $63,300 and a median home price of $977,000.
Halftime Adjustments Could Change the Game for Buyers
While it may feel like some divisions are winning and others are getting sacked by a crushing housing affordability blitz, the second half of the year brings reasons for optimism. Mortgage rates have moderated, incomes continue to rise, and house price growth is slowing—all signs that the affordability chains may be moving in buyers’ favor. For first-time buyers, that could mean more yards gained toward the homeownership end zone. Affordability may still be stuck deep in its own territory, but the field is shifting, and first-time buyers could soon be back in scoring position. The game isn’t over yet, and if first-time home buyers run the right route, homeownership could be a much simpler pitch and catch.
About the First-Time Home Buyer Outlook Report
Housing affordability is often reduced to a comparison of household income to house prices. This overlooks what matters to potential buyers – their house-buying power. First American’s proprietary First-Time Home Buyer Outlook Report examines first-time home buyer affordability by considering the share of homes for sale that are within the renter’s house-buying power. The larger the share of homes for sale that first-time home buyers can afford to buy, the more affordable the market.
First-time home buyer house-buying power is based on the median renter household’s income, the prevailing 30-year, fixed mortgage rate, the most recent year’s property tax rate for the geography of the renter, and assumes a fixed cost for private mortgage insurance, a 5 percent down payment and that one-third of their pre-tax income is used for the mortgage. The share of homes for sale is based on First American Data & Analytics’ aggregation of publicly recorded home sales. The median renter household’s income is derived from the 2024 Annual Social and Economic Supplement (ASEC) of the Current Population Survey. It was assumed that household income increased by 4 percent between 2024 and 2025, based on the annual growth in average hourly earnings between Q2 2024 and Q2 2025. This derived income was used in calculating renter house-buying power.


