Our Potential Home Sales Model, which measures what a healthy market for home sales should be based on the economic, demographic and housing market environments, decreased by 0.2 percent in August, and remains 3.4 percent lower than one year ago. While it seems that the steep decline in sales driven by the rapid rise in mortgage rates is behind us, sales remain low.
“Mortgage rate stability, even if the stabilization occurs at a higher level, is the key to a housing recovery.”
Existing-home sales will have a tough time gaining real momentum in a limited inventory environment where most homeowners are rate-locked into their homes – you can’t buy what’s not for sale. A higher mortgage rate environment resulting in limited sales helps to explain why the housing market has slipped back into a housing recession.
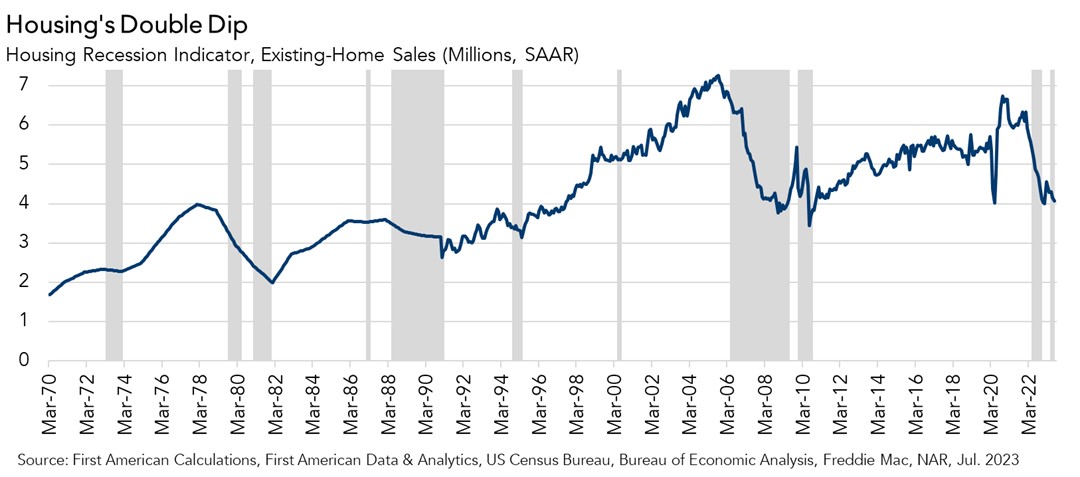
Housing’s Double Dip
According to our Housing Recession indicator, a comprehensive, rule-based model based on the National Bureau of Economic Research Business Cycle Dating Committee’s (NBER BCDC) method of calling recessions that relies on eight economic indicators, the housing market dipped back into recession in May. The housing market was in recession last year between May and November but pulled out of recession when mortgage rates eased late last year and the new-home market recovered. The resurgence in mortgage rates, constrained affordability, a slowing pace of sales, fewer residential housing jobs and less residential housing investment returned the housing market to recession.
The last time the housing market double dipped in and out of recession was during the Global Financial Crisis (GFC). The brief pause during the GFC housing recession, between July and November 2009, was precipitated in large part by a decline in mortgage rates from about 5.5 percent to 4.7 percent, which improved affordability and sparked a brief surge in existing-home sales. The GFC double-dip and the current double-dip highlights the sensitivity of the housing market to mortgage rate volatility. Sales, affordability, residential construction and the real estate-related labor market are all sensitive to mortgage rate trends.
Where Does the Housing Market Go from Here?
Mortgage rates increased in August, which means we expect the housing recessionary pressures to continue in the near-term until mortgage rates stabilize. However, industry forecasts predict that mortgage rates will moderate later in the year if the Federal Reserve stops further monetary tightening and provides investors with more certainty. Mortgage rate stability, even if the stabilization occurs at a higher level, is the key to a housing recovery.
August 2023 Potential Home Sales
For the month of August, First American updated its proprietary Potential Home Sales Model to show that:
- Potential existing-home sales decreased to a 5.34 million seasonally adjusted annualized rate (SAAR), a 0.2 percent month-over-month decrease.
- This represents a 53.2 percent increase from the market potential low point reached in February 1993.
- The market potential for existing-home sales decreased 3.4 percent compared with a year ago, a loss of 191,000 (SAAR) sales.
- Currently, potential existing-home sales is 1,449,000 (SAAR), or 21.3 percent, below the peak of market potential, which occurred in April 2006.
First American Deputy Chief Economist Odeta Kushi contributed to this post.
What Insight Does the Potential Home Sales Model Reveal?
When considering the right time to buy or sell a home, an important factor in the decision should be the market’s overall health, which is largely a function of supply and demand. Knowing how close the market is to a healthy level of activity can help consumers determine if it is a good time to buy or sell, and what might happen to the market in the future. That is difficult to assess when looking at the number of homes sold at a particular point in time without understanding the health of the market at that time. Historical context is critically important. Our potential home sales model measures what a healthy market for home sales should be based on the economic, demographic and housing market environments.
About the Potential Home Sales Model
Potential home sales measures existing-home sales, which include single-family homes, townhomes, condominiums and co-ops on a seasonally adjusted annualized rate based on the historical relationship between existing-home sales and U.S. population demographic data, homeowner tenure, house-buying power in the U.S. economy, price trends in the U.S. housing market, and conditions in the financial market. When the actual level of existing-home sales are significantly above potential home sales, the pace of turnover is not supported by market fundamentals and there is an increased likelihood of a market correction. Conversely, seasonally adjusted, annualized rates of actual existing-home sales below the level of potential existing-home sales indicate market turnover is underperforming the rate fundamentally supported by the current conditions. Actual seasonally adjusted annualized existing-home sales may exceed or fall short of the potential rate of sales for a variety of reasons, including non-traditional market conditions, policy constraints and market participant behavior. Recent potential home sale estimates are subject to revision to reflect the most up-to-date information available on the economy, housing market and financial conditions. The Potential Home Sales model is published prior to the National Association of Realtors’ Existing-Home Sales report each month.


