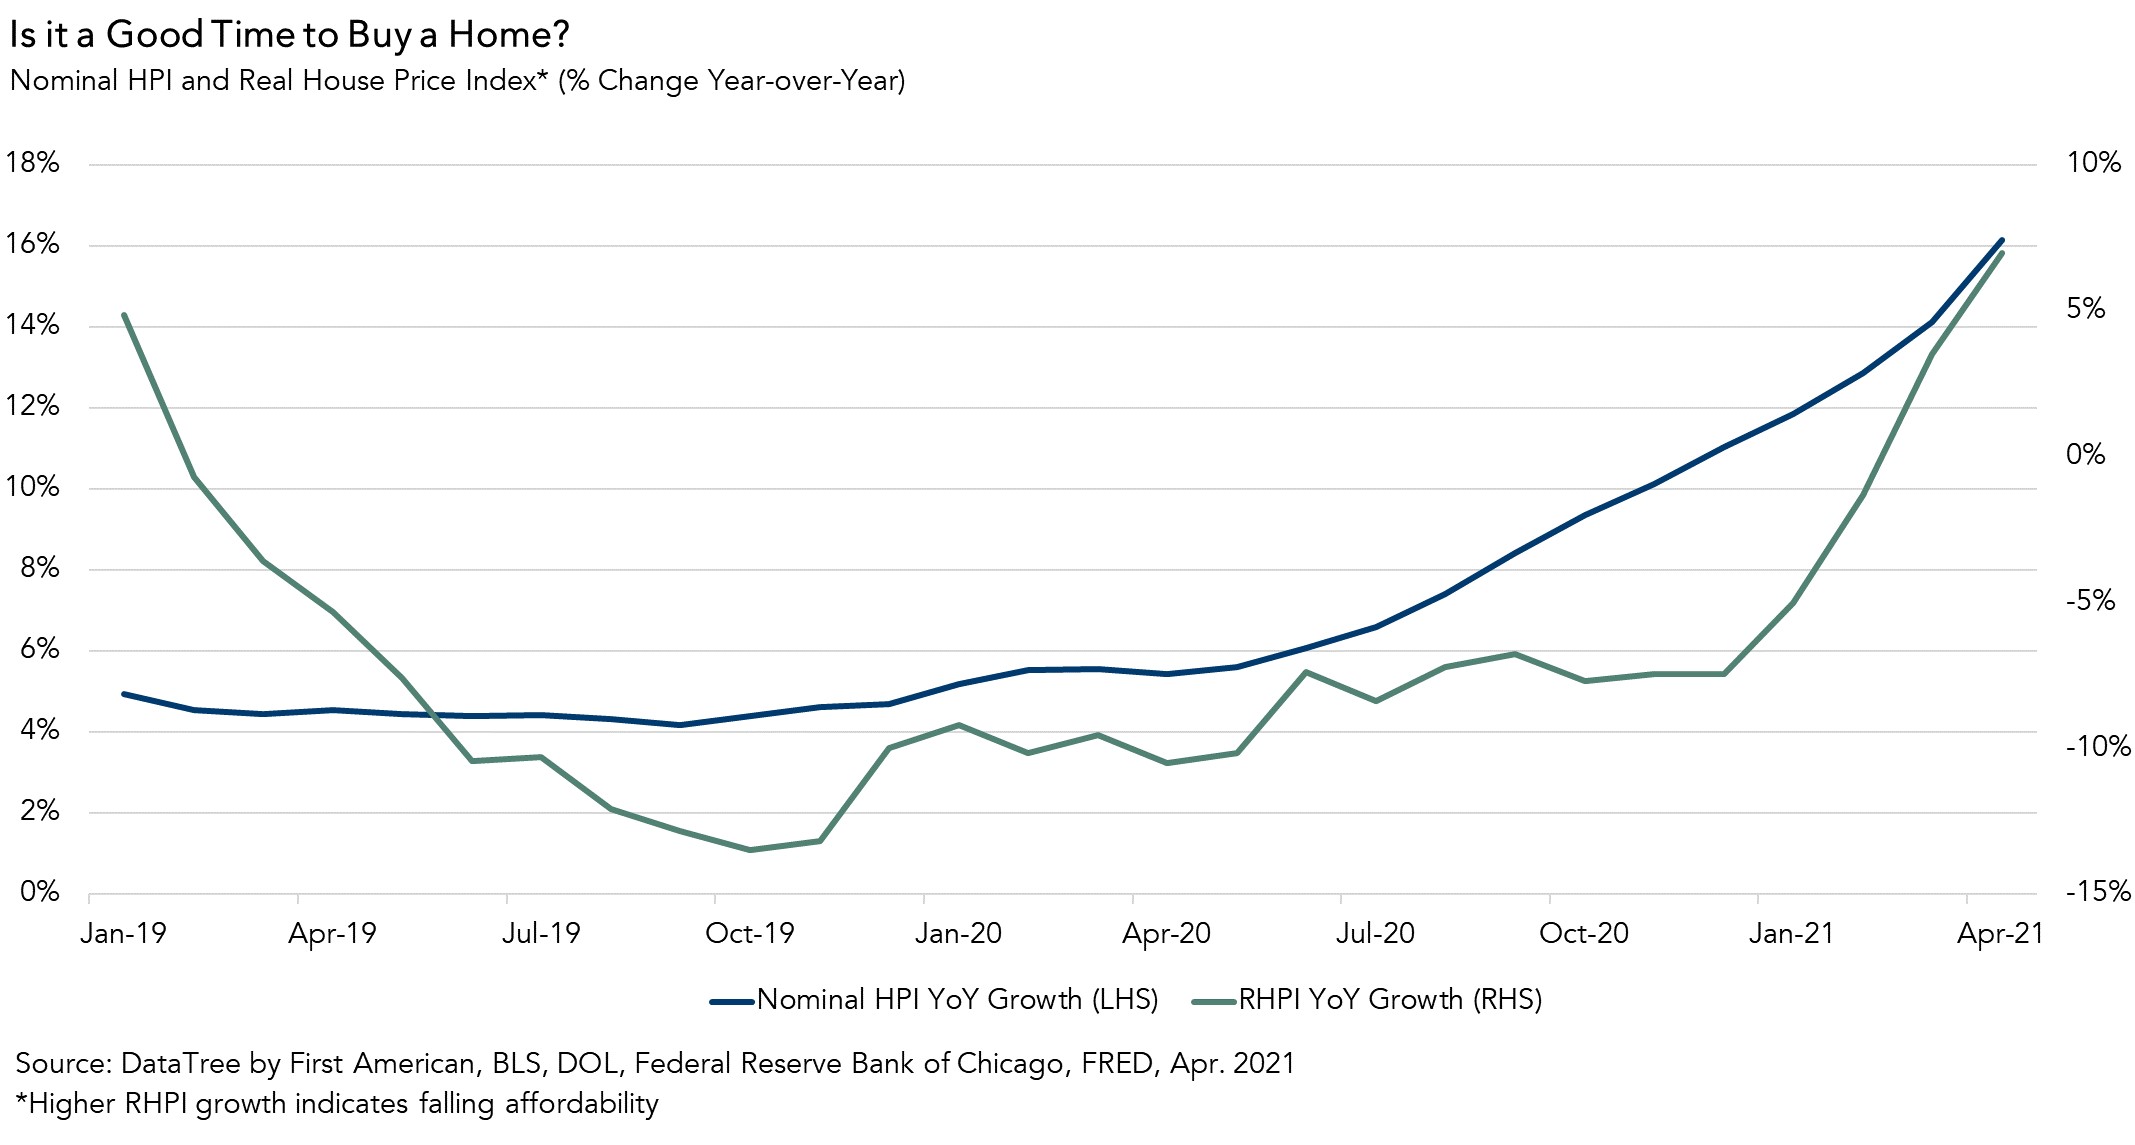
In today’s housing market, the power is very clearly in the hands of the seller. In April, First American Data & Analytics’ nominal house price index increased 16.2 percent year over year, the fastest pace since 2005. Rapid appreciation is driving declines in affordability, despite rising incomes and lower mortgage rates. Nationally, according to our Real House Price Index (RHPI), housing affordability declined in April on a year-over-year basis by 7.0 percent, the most since December 2018. Furthermore, homes typically remained on the market for 17 days in April, a record low. Multiple-offer bidding wars are common across the full spectrum of home prices. So, does this mean it’s a bad time to buy a home?
“Affordability is likely to worsen before it improves, so try to buy it now, if you can find it.”
How Might Housing Affordability Shift in the Months Ahead?
Wait for the housing market to cool down, or jump in before affordability declines further? That is the question potential home buyers are trying to answer. Buying a home is both a financial and lifestyle decision, so if an individual or family has made the lifestyle decision to buy, then it becomes a financial question. Will affordability decline in the months to come? If so, it may be a good time to buy before things get worse. Or, will buyers begin to back off, lowering the likelihood of bidding wars and causing house prices to moderate and affordability to bounce back?
Shifts in housing supply or demand can affect affordability. If supply increases and meets demand in the middle, house prices will moderate. Unfortunately, while inventory has ticked up slightly in recent weeks, it remains near historic lows and is not enough to compensate for a decade of underbuilding and homeowners simply staying put. It will take years for supply to catch up to demand and, in the meantime, any new housing inventory will be very quickly absorbed by the existing demand. So, significant housing supply relief is unlikely in the near term.
A substantial increase in mortgage rates could moderate demand. However, without an increase in income or a slowdown in house price growth, a rise in mortgage rates would accelerate the decline in affordability and squeeze buyers on the margin out of the market. A pull back of buyers on the margin may prompt fewer or less intense bidding wars, possibly moderating house price appreciation. Of course, even without rising mortgage rates, continued strong nominal house price growth would reduce affordability in the short run, squeezing more buyers out of the market and, eventually, reducing upward price pressure in the longer run.
Affordability Likely to Worsen Before it Improves
Examining each of these scenarios can provide insight into the likely direction of affordability. In April, nominal house price growth increased by 16.2 percent compared with a year ago, nearly double the 8.6 percent increase in house-buying power. For affordability to improve, house-buying power must outpace nominal house price growth. Looking ahead, consensus forecasts have mortgage rates peaking at an average of 3.4 percent by the fourth quarter of 2021. Assuming a household income of $70,000 and a 5 percent down payment, increasing from the current average mortgage rate of 3.0 percent to 3.4 percent would reduce house-buying power by nearly $24,000. All else held equal, household income would need to increase by approximately 5 percent to offset the affordability loss from rising mortgage rates. While incomes are expected to increase in the months to come as the economy continues to improve, it’s unclear if it will reach a pace necessary to offset the potential for rising mortgage rates.
More important is the outlook for nominal house price growth. While nominal house price growth may moderate due to the affordability squeeze on buyers who are on the margin, the severe supply-demand imbalance means the housing market is unlikely to cool enough to result in a material improvement in affordability. Even if demand moderates due to an affordability squeeze, it will take time for supply to catch up with demand, keeping house price growth positive. So, should you buy now or wait? Real estate is local, and affordability will depend on where you are, but affordability is likely to worsen before it improves, so try to buy it now, if you can find it.
For more analysis of affordability, please visit the Real House Price Index. The RHPI is updated monthly with new data. Look for the next edition of the RHPI the week of July 26, 2021.
Sources:
April 2021 Real House Price Index Highlights
The First American Real House Price Index (RHPI) showed that in April 2021:
- Real house prices increased 0.7 percent between March 2021 and April 2021.
- Real house prices increased 7.0 percent between April 2020 and April 2021.
- Consumer house-buying power, how much one can buy based on changes in income and interest rates, increased 1.4 percent between March 2021 and April 2021, and increased 8.6 percent year over year.
- Median household income has increased 5.3 percent since April 2020 and 78.7 percent since January 2000.
- Real house prices are 20.9 percent less expensive than in January 2000.
- While unadjusted house prices are now 27.4 percent above the housing boom peak in 2006, real, house-buying power-adjusted house prices remain 44.4 percent below their 2006 housing boom peak.
April 2021 Real House Price State Highlights
- The five states with the greatest year-over-year increase in the RHPI are: Arizona (+18.3 percent), Washington (+16.1 percent), Vermont (+15.3 percent), Wyoming (+15.2 percent), and Oklahoma (+14.0 percent).
- There were no states with a year-over-year decrease in the RHPI.
April 2021 Real House Price Local Market Highlights
- Among the Core Based Statistical Areas (CBSAs) tracked by First American, the five markets with the greatest year-over-year increase in the RHPI are: Phoenix (+20.8 percent), Kansas City, Mo. (+20.5 percent), Seattle (+18.2 percent), Tampa, Fla. (+16.5 percent), and Hartford, Conn. (+14.6 percent).
- Among the Core Based Statistical Areas (CBSAs) tracked by First American, the only market with a year-over-year decrease in the RHPI is San Francisco (-0.7 percent).
Next Release
The next release of the First American Real House Price Index will take place the week of July 26, 2021.
April’s release includes an annual update to the state and CBSA household income series, which may result in large revisions.
About the First American Real House Price Index
The traditional perspective on house prices is fixated on the actual prices and the changes in those prices, which overlooks what matters to potential buyers - their purchasing power, or how much they can afford to buy. First American’s proprietary Real House Price Index (RHPI) adjusts prices for purchasing power by considering how income levels and interest rates influence the amount one can borrow.
The RHPI uses a weighted repeat-sales house price index that measures the price movements of single-family residential properties by time and across geographies, adjusted for the influence of income and interest rate changes on consumer house-buying power. The index is set to equal 100 in January 2000. Changing incomes and interest rates either increase or decrease consumer house-buying power. When incomes rise and mortgage rates fall, consumer house-buying power increases, acting as a deflator of increases in the house price level. For example, if the house price index increases by three percent, but the combination of rising incomes and falling mortgage rates increase consumer buying power over the same period by two percent, then the Real House Price index only increases by 1 percent. The Real House Price Index reflects changes in house prices, but also accounts for changes in consumer house-buying power.
Disclaimer
Opinions, estimates, forecasts and other views contained in this page are those of First American’s Chief Economist, do not necessarily represent the views of First American or its management, should not be construed as indicating First American’s business prospects or expected results, and are subject to change without notice. Although the First American Economics team attempts to provide reliable, useful information, it does not guarantee that the information is accurate, current or suitable for any particular purpose. © 2021 by First American. Information from this page may be used with proper attribution.


