Housing market potential strengthened again last month, according to our Potential Home Sales Model, despite significant supply headwinds. In May, housing market potential increased 0.8 percent compared with April, and is now nearly 23 percent higher than the pandemic-driven decline last May. Relative to two years ago, housing market potential is nearly 18 percent higher.
“It all comes down to the fundamentals. House-buying power drives the market potential for existing-home sales, but market potential is limited by what you can buy.”
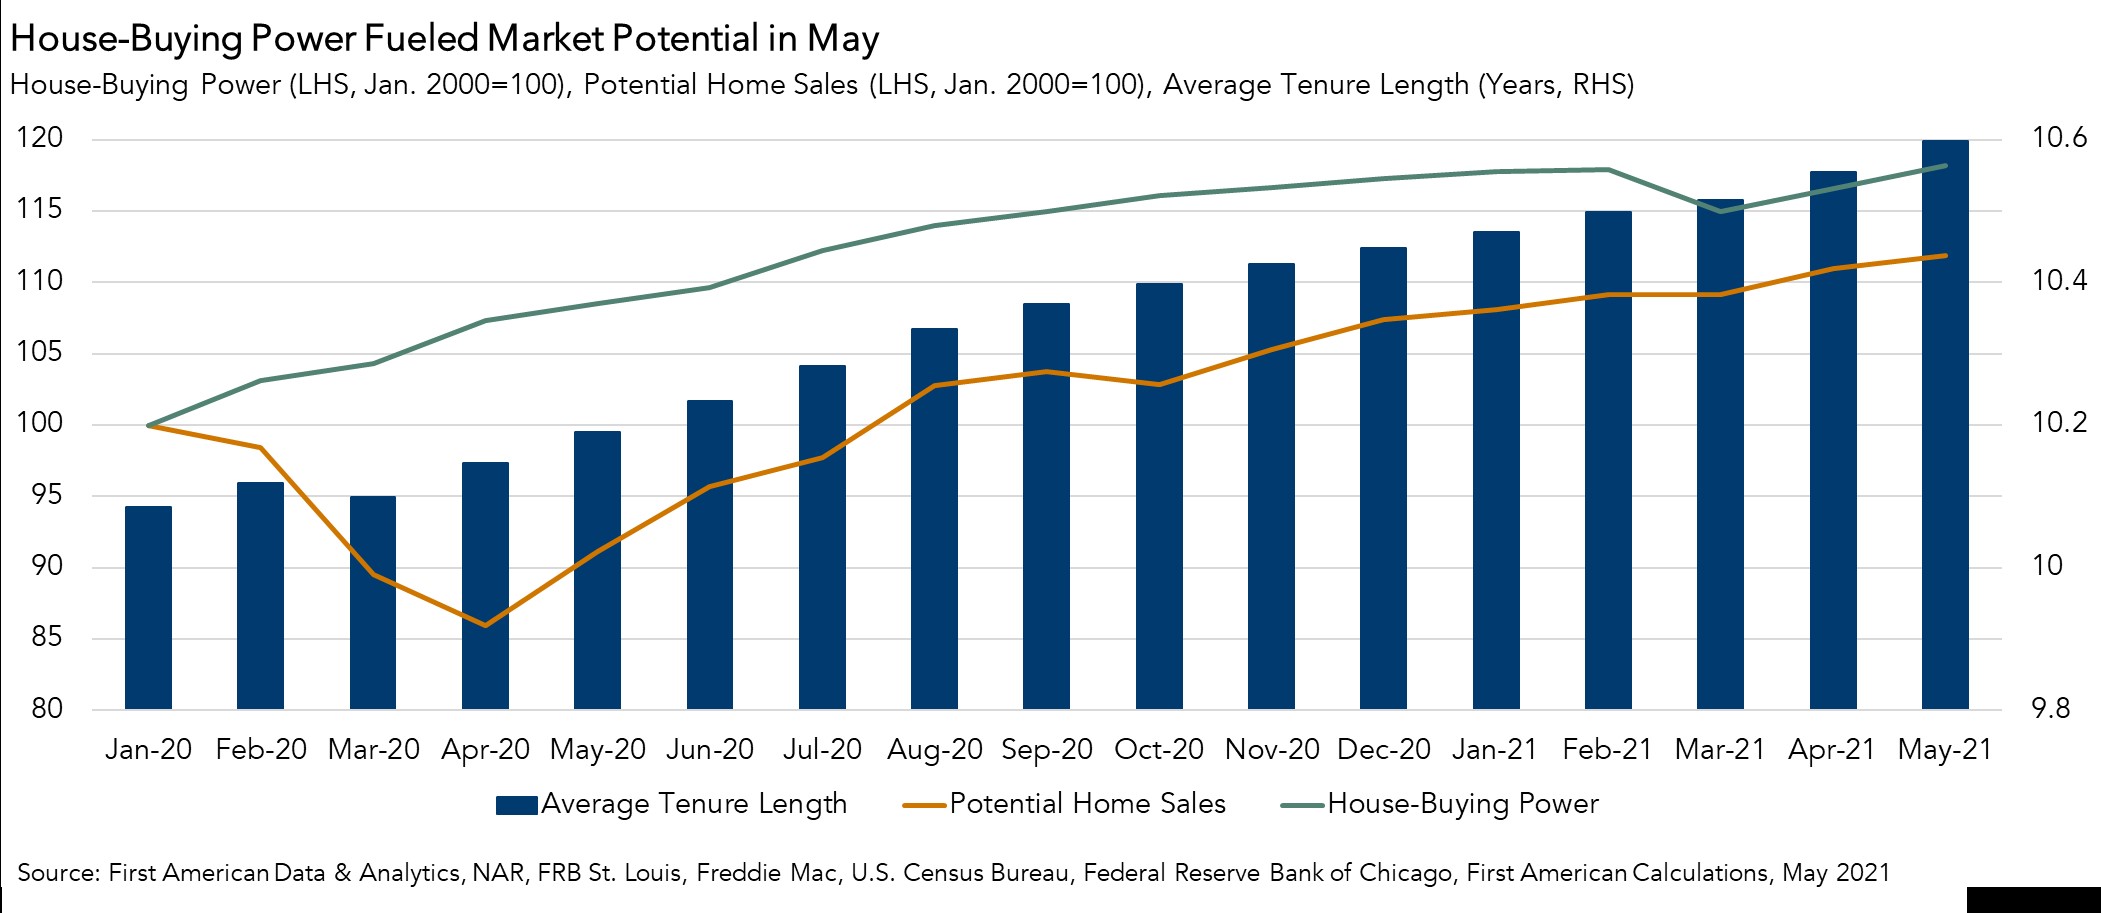
A dip in mortgage rates and slight uptick in household income fueled an increase in house-buying power that was large enough to offset the largest monthly increase in tenure length since August 2020. Despite the pandemic-driven demand for more space and shift away from urban areas, the average tenure length – the amount of time a typical homeowner lives in their home – continues to set new records. You can’t buy what’s not for sale, even if your buying power says you can afford it.
Pandemic-Accelerated Demand Trends Collide with Homebodies – To the Winner Goes Housing Market Potential
House-buying power, which is a function of mortgage rates and household income, increased by approximately $7,100 in May, contributing to a gain of nearly 31,000 potential home sales compared with last month. Both mortgage rates and household income swung in favor of increased house-buying power in May, offsetting the historic lack of supply. The primary cause of the lack of supply? Homebodies, existing homeowners choosing to remain in place and not list their homes for sale, a trend that has hampered housing market potential for several years and continues to worsen.
Homebodies, the Immovable Object
Average tenure length jumped nearly 4 percent from one year ago, and 0.4 percent compared with last month. The monthly gain was the largest since August 2020. The monthly increase in average tenure length contributed to a loss of over 17,000 potential home sales. Since existing homeowners supply the majority of the homes for sale, and increasing tenure length indicates homeowners are not selling, the housing market faces an ongoing supply shortage.
Before the housing market crash in 2007, the average length of time someone lived in their home was approximately five years. Average tenure length grew to approximately eight years during the aftermath of the housing market crisis between 2008 and 2016. The most recent data shows that the average length of time someone lives in their home reached 10.6 years in May 2021, an historic high.
Two trends are locking homebodies in place and driving the increase in tenure length. First, for homeowners with rock-bottom rates, modestly higher rates in an historically low inventory environment may disincentivize some from selling their homes, thus preventing more supply from reaching the market. Second, seniors are choosing to age in place. Analysis of the 2020 ASEC data reveals that the homeownership rate actually increased for baby boomers in 2020. While a 2019 study from Freddie Mac shows that if seniors and adults born between 1931-1959 behaved like earlier generations, they would have released nearly 1.6 million additional housing units to the market by 2018. As seniors continue to choose to age in place, there will be fewer existing homes available for sale.
What Does it all Mean for Housing Market Potential?
It all comes down to the fundamentals. House-buying power drives the market potential for existing-home sales, but market potential is limited by what you can buy. The demand for homes is strong as millennials continue to age into homeownership, mortgage rates remain low, and the economy begins to improve. Yet, we need more existing homes for sale to satisfy this growing demand. You can’t buy what’s not for sale – and the homebodies don’t seem ready to relieve the supply pressure, keeping a lid on market potential growth.
May 2021 Potential Home Sales
For the month of May, First American updated its proprietary Potential Home Sales Model to show that:
- Potential existing-home sales increased to a 6.34 million seasonally adjusted annualized rate (SAAR), a 0.8 percent month-over-month increase.
- This represents an 81.8 percent increase from the market potential low point reached in February 1993.
- The market potential for existing-home sales increased 22.7 percent compared with a year ago, a gain of 1,173,038 (SAAR) sales. The year-over-year comparison is very large this month because economic activity in May of 2020, including the housing market, was significantly curtailed due to the pandemic. Housing rebounded sharply in the summer.
- Currently, potential existing-home sales is 453,138 (SAAR), or 6.7 percent below the pre-recession peak of market potential, which occurred in April 2006.
Market Performance Gap
- The market for existing-home sales outperformed its potential by 4.3 percent or an estimated 272,588 (SAAR) sales.
- The market performance gap increased by an estimated 31,341 (SAAR) sales between April 2021 and May 2021.
First American Deputy Chief Economist Odeta Kushi contributed to this post.
What Insight Does the Potential Home Sales Model Reveal?
When considering the right time to buy or sell a home, an important factor in the decision should be the market’s overall health, which is largely a function of supply and demand. Knowing how close the market is to a healthy level of activity can help consumers determine if it is a good time to buy or sell, and what might happen to the market in the future. That is difficult to assess when looking at the number of homes sold at a particular point in time without understanding the health of the market at that time. Historical context is critically important. Our potential home sales model measures what we believe a healthy market level of home sales should be based on the economic, demographic and housing market environments.
About the Potential Home Sales Model
Potential home sales measures existing-home sales, which include single-family homes, townhomes, condominiums and co-ops on a seasonally adjusted annualized rate based on the historical relationship between existing-home sales and U.S. population demographic data, homeowner tenure, house-buying power in the U.S. economy, price trends in the U.S. housing market, and conditions in the financial market. When the actual level of existing-home sales are significantly above potential home sales, the pace of turnover is not supported by market fundamentals and there is an increased likelihood of a market correction. Conversely, seasonally adjusted, annualized rates of actual existing-home sales below the level of potential existing-home sales indicate market turnover is underperforming the rate fundamentally supported by the current conditions. Actual seasonally adjusted annualized existing-home sales may exceed or fall short of the potential rate of sales for a variety of reasons, including non-traditional market conditions, policy constraints and market participant behavior. Recent potential home sale estimates are subject to revision to reflect the most up-to-date information available on the economy, housing market and financial conditions. The Potential Home Sales model is published prior to the National Association of Realtors’ Existing-Home Sales report each month.

.jpg)
