June marked the 10-year anniversary of the end of the Great Recession. Amid Independence Day celebrations, assessing how the American dream of homeownership has fared since the recession can provide helpful context for the health of today’s housing market. We have assembled a set of housing metrics and compared their values today with what those metrics looked like at the end of the Great Recession.
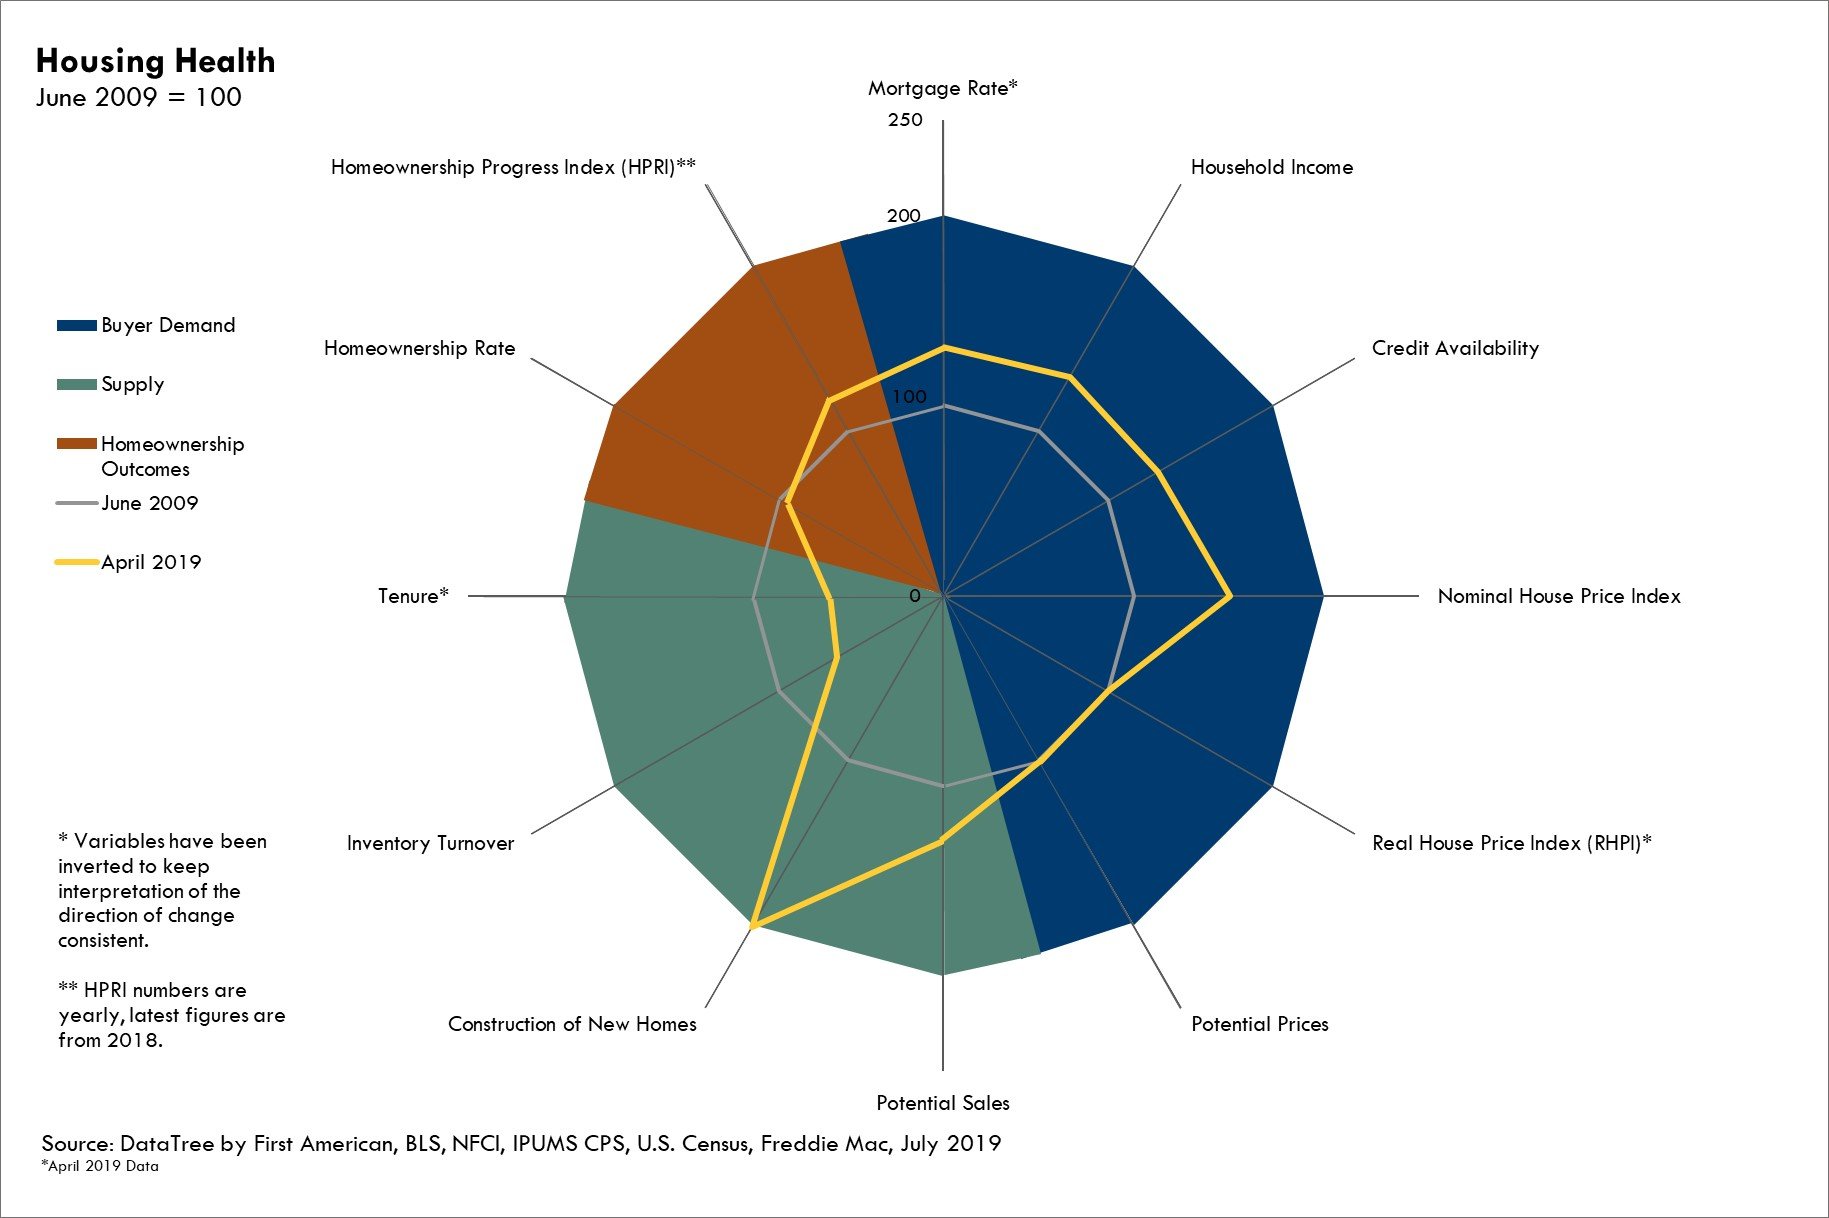
In the chart below, housing demand metrics (blue), supply metrics (green), and homeownership metrics (red) are scaled relative to their level at the end of the Great Recession (100). That means that the metrics can be interpreted as percentage gains or losses relative to that point. For example, a metric with a value of 150 today has improved by 50 percent relative to its value at the end of the Great Recession. Today’s housing market enjoys much stronger demand than a decade ago, but housing supply has slumped.
Increased Affordability and Greater Access to Credit Boost Demand
Since the end of the Great Recession, affordability has improved, largely driven by lower mortgage rates and rising household income. Mortgage rates are even lower than a decade ago – the 30-year, fixed mortgage rate in April was 4.1 percent, 1.3 percent lower than in June 2009. The lower mortgage rate, combined with higher household income, has increased consumer house-buying power by 54 percent since the end of the recession. At the same time, credit availability has improved by 30 percent according to the Urban Institute Credit Availability Index, increasing the number of potential home buyers.
While nominal house prices are now 51 percent higher than at the end of the Great Recession, nominal house prices do not tell the full story on affordability. The Real House Price Index (RHPI), which adjusts nominal house prices for the influence of changes in household income and the mortgage rate on consumer house-buying power, is at the same level as 10 years ago. Greater consumer house-buying power has offset the increase in nominal prices.
More house-buying power and expanded access to credit, along with a demographic tailwind from millennials aging into prime home-buying age, all bode well for housing market demand. The question is whether there are enough homes for sale to meet this surging demand.
Supply Deficit Grows
The short answer is no. Inventory turnover, the total supply of new and existing homes for sale as a percent of the stock of residential houses, has declined by 16 percent since 2009. A major reason for the lack of homes for sale is increasing tenure – the length of time a homeowner lives in their home. In the years following the recession, tenure has rapidly increased and it is currently more than 11 years, compared to just under seven years at the end of the Great Recession. Increasing tenure means existing homeowners, who supply the majority of homes for sale, are not selling and is the byproduct of two trends – older homeowners aging in place and many existing homeowners being locked-in with historically low mortgage rates.
A natural solution to a housing supply shortage is to build more homes. Yet, for more than a decade, home building has not kept up with the demand for shelter. While housing starts, a leading indicator of new home completions, have doubled since the lows reached at the end of the recession, they remain 33 percent below their 2000 level.
The home-building deficit (not pictured), which is the difference between the addition of new homes to the housing stock and new demand for homes from household formation, has been cut in half since 2009. However, the gap between supply and demand today remains high. In 2018, 1.2 million new households were formed, while net new supply of housing units was below 900,000 units. New household formation is expected to continue to grow as millennials are still forming households, so the need for more housing is likely to also grow.
Housing Largely Recovered, But Lack of Supply Lingers
Despite a lack of supply, the homeownership rate has increased from a low of 63.4 percent in 2016 to 64.4 percent in 2018, which is very close to the homeownership rate at the end of the Great Recession. Our Homeownership Progress Index (HPRI), which estimates the homeownership rate given the underlying demographic and economic conditions, trended upward since 2010 and is currently 73 percent. The increase reflects the impact of millennials pursuing higher education and making other key life decisions that increase the likelihood of homeownership.
After 10 years, the housing market has recovered from the Great Recession by many metrics. Demand is stronger, but a decade of building deficits has helped create a significant supply shortage. After all – you can’t buy what’s not for sale.
Ksenia Potapov contributed to this blog post.


