As we reflect on our country’s recent Independence Day commemoration, we find that the desire to achieve the American dream of homeownership still exists. Because, while the U.S. homeownership rate remains close to half-century lows, demand is strong, especially among millennials. In fact, results of our Real Estate Sentiment Index survey of title agents and real estate professionals conducted in the second quarter of 2018 showed nearly 87 percent of first-time home buyers were in the prime home-buying age of 26 to 35, which corresponds with the ages of millennials.
When considering homeownership rates, it’s important to note that traditional measures do not account for shifts in underlying demographic or economic factors. Instead, they report only the share of households that are homeowners. Analysis based on these traditionally calculated homeownership rates has resulted in mistaken conclusions that are often propagated as conventional wisdom. We developed our annual Homeownership Progress Index (HPRI) to provide a more in-depth look into the changes in homeownership rates over time by accounting for the impact of critical lifestyle, societal and economic trends that influence the likelihood of renting or owning a home. Understanding these homeownership characteristics and tracking how they change over time allows us to measure potential homeownership demand.
"When millions of millennials are ready to become homeowners, will the housing market have enough homes for them?"
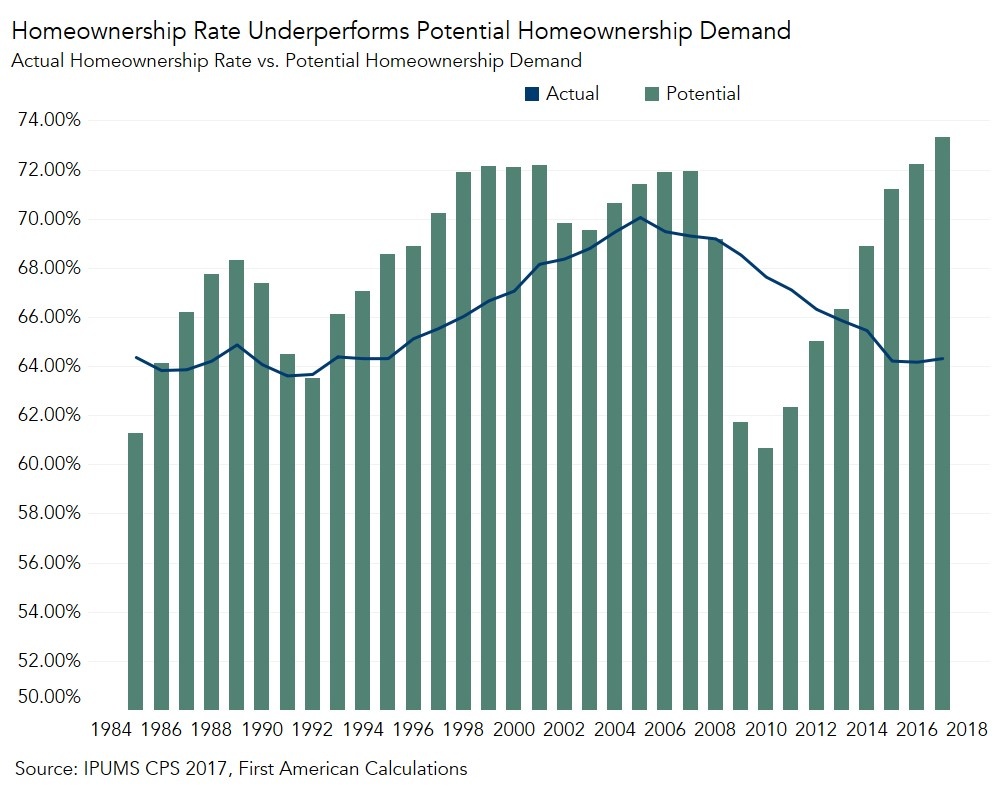
Homeownership Rate Continues to Underperform Potential
The figure below shows the actual homeownership rate versus potential homeownership demand represented by the HPRI. In years past, potential homeownership demand was greater than the actual homeownership rate. This was largely due to baby boomers making the lifestyle and economic decisions that drive homeownership demand, notably settling down to form households of their own. From 1984 to 1986 and again in 1992, the actual homeownership rate was at or above the potential demand. This was most likely a result of innovations in mortgage finance, and the economic boom of the 1990s. In the late 1990s to the early 2000s, the potential demand again peaked above the actual homeownership rate. Achieving the dream of homeownership may have been restricted then by access to credit or the down payment necessary to purchase a first home.
The housing crisis brought an interesting change, as the homeownership rate exceeded the potential demand from 2008 to 2012. Speculation, easy access to credit and exuberance during the housing boom of 2004-2007 spurred the homeownership rate to record highs. As the housing market turned in 2008 and economic fundamentals supporting potential homeownership demand decreased in subsequent years, the homeownership rate exceeded potential homeownership demand, with the gap reaching almost 9 percent at its peak in 2010.
This contrasts sharply with the dynamic observed in 2017, the most recent year of available data to estimate the HPRI. In 2017, potential homeownership demand grew by one percent over the prior year, while the actual homeownership rate underperformed potential demand by almost 9 percent. So, what could be the cause of this?
Millennial Demand Yet to Peak
One likely answer rests with the largest generational cohort – millennials. Millennials are often referred to as a “renter generation,” because they have prioritized furthering their education and thus delayed getting married and having children, which are critical lifestyle triggers to buying a first home. However, the dream of homeownership is far from dead for this age group. Nearly 80 percent of millennials who responded to a recent study by Harvard University’s Joint Center for Housing Studies agreed that homeownership was part of achieving the American Dream. Is it possible that they are not rejecting homeownership, but rather, simply delaying it?
Are Millennials Rejecting, or Just Delaying, Marriage?
Homeownership is strongly correlated with marriage, and millennials are getting married later than earlier generations. The median age for a first marriage in 2016 was 27.4 for women and 29.5 for men – roughly seven years more than the median ages in 1960. According to analysis in our HPRI, the homeownership rate is 30 percent higher among married couples than other households.
We find that the decision to have children also influences the decision to own. Compared to households with no children, the homeownership rate is 5.4 percent higher for households with one or two children, and an additional percent point higher for households with three or more children. Millennial lifestyle choices to delay marriage and children are part of the reason the homeownership rate is lower than we expect.
Millennials Keep Getting Smarter
While important lifestyle decisions, such as marriage or owning a home, appear to take place later in life for millennials, they are getting educated in unprecedented numbers. As educational attainment levels increase, we can expect homeownership rates to eventually grow, as well. In fact, the importance of education to homeownership has only increased over time. Our HPRI shows that the impact of education in relation to homeownership has nearly doubled in 10 years. In 1997, the difference in the homeownership rate between those without a high school degree and those with a college degree was 11 percent. By 2016, this gap had widened to 21.3 percent, though it did experience a modest decline in 2017 to 20.5 percent. This goes to show that for many millennials, the key to homeownership will be getting a college education.
Millennials’ lifestyle and economic decisions are some of the main reasons we currently have a lower homeownership rate than expected, based on our HPRI. Yet, it is reasonable to expect homeownership rates to grow as millennials continue to make important decisions, including attaining an education and, later in life, getting married and buying a home. However, the question remains: as millions of millennials look to purchase their first homes, will the housing market provide enough homes for them?
For Mark’s full analysis on potential homeownership demand, the top five states and markets with the greatest increases and decreases in the HPRI, and more, please visit the Homeownership Progress Index.
The HPRI is updated annually with new data. Look for the next edition of the HPRI in June 2019.
What makes it a Homeownership Progress Index?
Traditional measures of homeownership rates do not account for shifts in underlying demographic or economic factors. Instead, they report just the share of households that are homeowners. Analysis based on these traditionally calculated homeownership rates has resulted in mistaken conclusions that are often propagated as conventional wisdom. The HPRI provides a deeper look into the changes to homeownership rates over time by accounting for, and isolating, the impact of critical lifestyle, societal and economic trends that influence the likelihood of renting or owning a home.
Why does the HPRI tell a different story than other measures?
Changing demographic and economic factors either increase or decrease someone’s potential to be a homeowner. For example, increasing marital rates, household size, educational attainment, income and improving economic conditions all increase potential demand for homeownership. The HPRI measures the potential for homeownership demand based on these underlying factors. For example, the potential for, or likelihood of, homeownership may increase because of rising educational attainment or income growth. It’s important to point out that the likelihood of homeownership doesn’t have to match the actual homeownership rate. For example, it’s possible that someone may be highly likely to desire homeownership, but are unable to find any houses they can afford to buy. In that case, potential homeownership demand would be higher than the actual homeownership rate.
What do the HPRI number values mean?
The HPRI value is the percentage of households that are likely to be homeowners, based on underlying lifestyle, societal, and economic conditions, instead of renters. Changes over time in the HPRI are caused by changes in the underlying lifestyle, societal and economic trends.
About the First American Homeownership Progress Index
The First American Homeownership Progress Index is an economic model that uses annual IPUMS CPS individual anonymized census survey data to measure the influence of household circumstances and demographic, societal and economic characteristics on one’s choice to own a home. Demographic characteristics include age, race/ethnicity, gender, marital status and number of children. Additionally, the model includes educational attainment, income, the 30-year fixed rate mortgage rate and the unemployment rate to help explain changes in homeownership rates. The individual factors influencing homeownership can be isolated, while all other factors are held equal, to provide a unique perspective on the impact the isolated factor has on the likelihood of homeownership.
The HPRI can provide the likelihood of homeownership for a given demographic and economic profile. For example, an educated man with two children and a higher income will have a higher likelihood of homeownership than a single man without a higher education degree.


