Affordability improved in July as two of the three key drivers of the Real House Price Index (RHPI), household income and mortgage rates, swung in favor of increased affordability, outpacing the rise in nominal house price appreciation. The average 30-year, fixed mortgage rate fell by 0.75 percentage points and household income increased 5.5 percent compared with July 2019. Declining mortgage rates and rising household income levels both increase consumer house-buying power. So, even though nominal house price appreciation jumped 8.2 percent annually in July, it was not enough to offset the affordability boost from declining rates and rising household income.
“Recent history has shown that in times of economic distress, lower mortgage rates have offset the affordability drag from faster house price appreciation and lower household income.”
While there remains debate regarding the actual end date of the 2020 recession, there is no argument that the economic pain inflicted by the coronavirus continues to linger. Yet, housing affordability nationally has improved, and the housing market remains resilient. But, how have nominal house prices and affordability fared in previous economic declines and what can that tell us about today’s housing market?
How Nominal House Prices Fare During Recessions
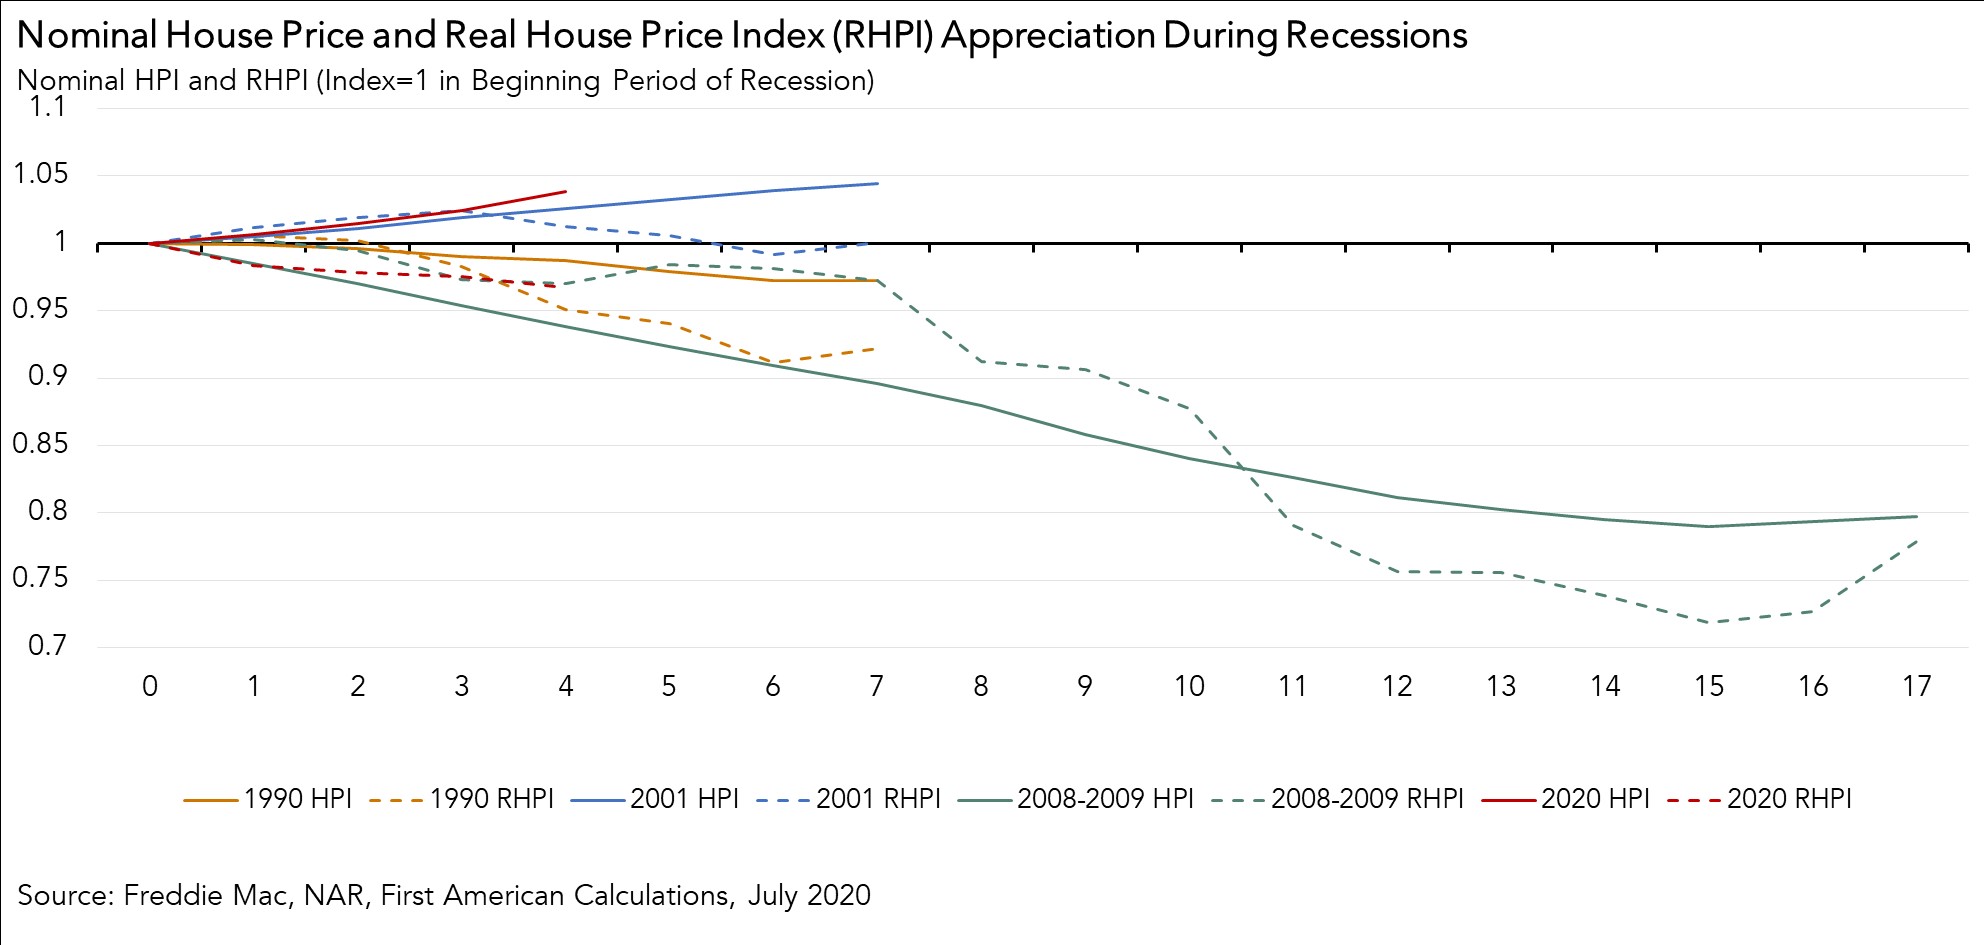
The chart below shows how nominal house prices and the RHPI reacted to the four most recent recessions, including the current pandemic-driven economic downturn. It is important to note that a declining RHPI trend line indicates improving affordability, and a rising RHPI trend line signals worsening affordability.
With the exception of the Great Recession in 2008-2009 and a modest decline in the 1990 recession, nominal house prices have remained flat or risen slowly, but have not declined. This demonstrates the “downside stickiness” of house prices during economic decline. In the pandemic-driven recession of 2020, we’ve seen house price appreciation grow faster than in any of the economic declines in our recent past.
This phenomenon of continued house price appreciation amid economic decline is unique to the housing market because sellers tend to withdraw supply to wait out the economic storm, rather than sell at lower prices. During the Great Recession, house prices declined because of a flood of foreclosures and distressed selling, which were a product of rapid house price appreciation not entirely supported by economic fundamentals. In today’s market, nominal house price appreciation has been driven by a historic shortage of supply relative to demand.
Real House Prices Then Versus Now
In three of the four economic downturns we examined, affordability as measured by the RHPI improved. Why? The RHPI adjusts nominal house prices for purchasing power by considering how income levels and interest rates influence the amount one can borrow. While nominal house prices may continue to rise during a recession and median household incomes tend to remain the same or fall, mortgage rates typically decline. The popular 30-year, fixed mortgage rate is loosely benchmarked to the 10-year Treasury bond and, in times of economic uncertainty, investors flee stocks and rush to bonds, pushing yields down, which brings mortgage rates down as well.
The only exception is the 2001 recession, when incomes fell and house price appreciation continued to rise, while mortgage rates also increased slightly at the beginning of the recession, causing a modest decline in affordability. The interplay between mortgage rates, income, and house price appreciation drive affordability trends. In the 2020 economic downturn, while house prices have continued to rise, rates have fallen to historic lows and income has grown modestly, resulting in an affordability boost.
Will the Trend Continue?
Nominal house price appreciation is showing no signs of slowing down, as supply and demand imbalances persist. While mortgage rates have, thus far, won the affordability tug-of-war nationally, some housing markets are beginning to feel the impact of pandemic-driven job losses on household income levels. In these markets, accelerating house price appreciation, in conjunction with flat or falling income levels, is dragging affordability down. The lesson? Affordability is resilient in the face of economic downturns, but just how resilient depends on the dynamics of mortgage rates, income, and house price appreciation.
For more analysis of affordability, please visit the Real House Price Index.
The RHPI is updated monthly with new data. Look for the next edition of the RHPI the week of October 26, 2020.
Sources:
July 2020 Real House Price Index Highlights
The First American Real House Price Index (RHPI) showed that in July 2020:
- Real house prices decreased 0.8 percent between June 2020 and July 2020.
- Real house prices declined 6.6 percent between July 2019 and July 2020.
- Consumer house-buying power, how much one can buy based on changes in income and interest rates, increased 2.2 percent between June 2020 and July 2020, and increased 15.8 percent year over year.
- Median household income has increased 5.5 percent since July 2019 and 70 percent since January 2000.
- Real house prices are 26 percent less expensive than in January 2000.
- While unadjusted house prices are now 14.2 percent above the housing boom peak in 2006, real, house-buying power-adjusted house prices remain 48 percent below their 2006 housing boom peak.
July 2020 Real House Price State Highlights
- The only state with a year-over-year increase in the RHPI is Wyoming (+1.5 percent).
- The five states with the greatest year-over-year decrease in the RHPI are: Massachusetts (-11.4 percent), New Hampshire (11.0 percent), Nevada (-10.5 percent), Maryland (-9.5 percent), and California (-9.4 percent).
July 2020 Real House Price Local Market Highlights
- Among the Core Based Statistical Areas (CBSAs) tracked by First American, the five markets with the greatest year-over-year increase in the RHPI are: Pittsburgh (+4.2 percent), Cleveland (+2.2 percent), Seattle (+1.7 percent), Houston (+1.4 percent), and New Orleans (+1.0 percent).
- Among the Core Based Statistical Areas (CBSAs) tracked by First American, the five markets with the greatest year-over-year decrease in the RHPI are: Boston (-13.8 percent), San Francisco (-13.5 percent), San Jose, Calif. (-12.2 percent), Baltimore (-11.2 percent), and San Diego (-11.2 percent).
About the First American Real House Price Index
The traditional perspective on house prices is fixated on the actual prices and the changes in those prices, which overlooks what matters to potential buyers - their purchasing power, or how much they can afford to buy. First American’s proprietary Real House Price Index (RHPI) adjusts prices for purchasing power by considering how income levels and interest rates influence the amount one can borrow.
The RHPI uses a weighted repeat-sales house price index that measures the price movements of single-family residential properties by time and across geographies, adjusted for the influence of income and interest rate changes on consumer house-buying power. The index is set to equal 100 in January 2000. Changing incomes and interest rates either increase or decrease consumer house-buying power. When incomes rise and mortgage rates fall, consumer house-buying power increases, acting as a deflator of increases in the house price level. For example, if the house price index increases by three percent, but the combination of rising incomes and falling mortgage rates increase consumer buying power over the same period by two percent, then the Real House Price index only increases by 1 percent. The Real House Price Index reflects changes in house prices, but also accounts for changes in consumer house-buying power.
Disclaimer
Opinions, estimates, forecasts and other views contained in this page are those of First American’s Chief Economist, do not necessarily represent the views of First American or its management, should not be construed as indicating First American’s business prospects or expected results, and are subject to change without notice. Although the First American Economics team attempts to provide reliable, useful information, it does not guarantee that the information is accurate, current or suitable for any particular purpose. © 2020 by First American. Information from this page may be used with proper attribution.


