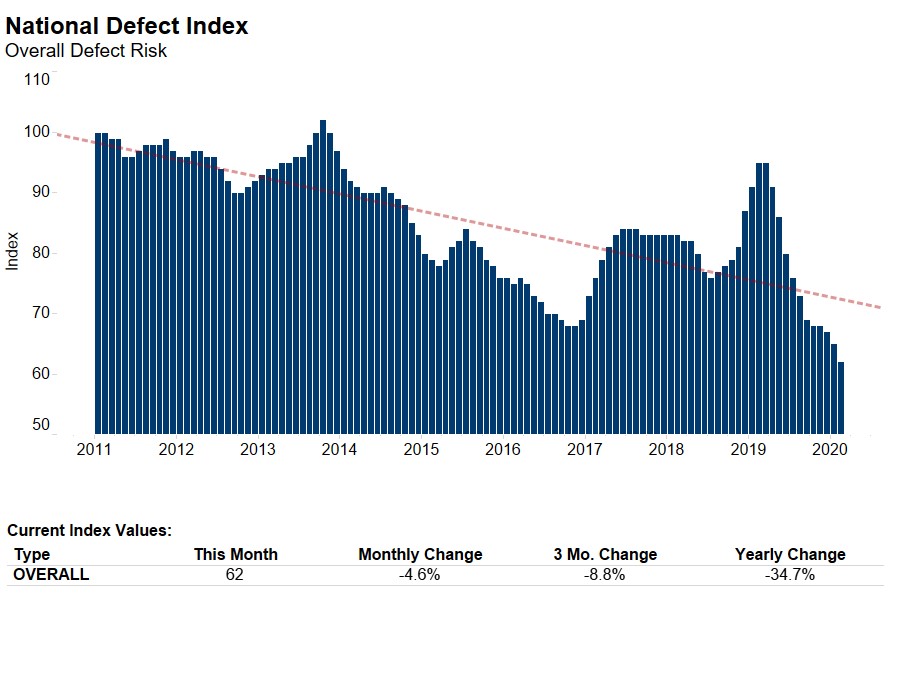
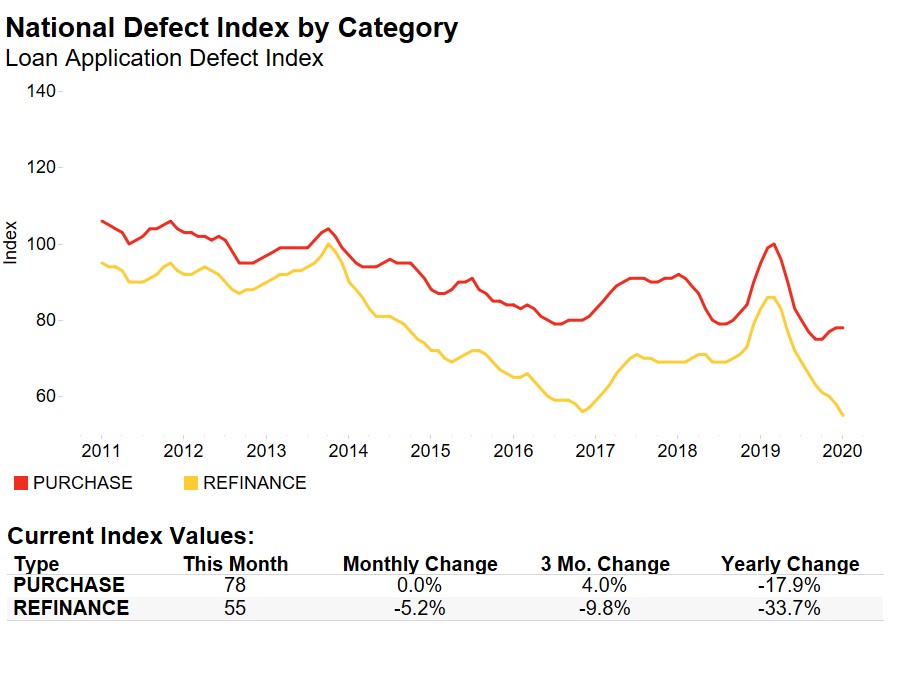
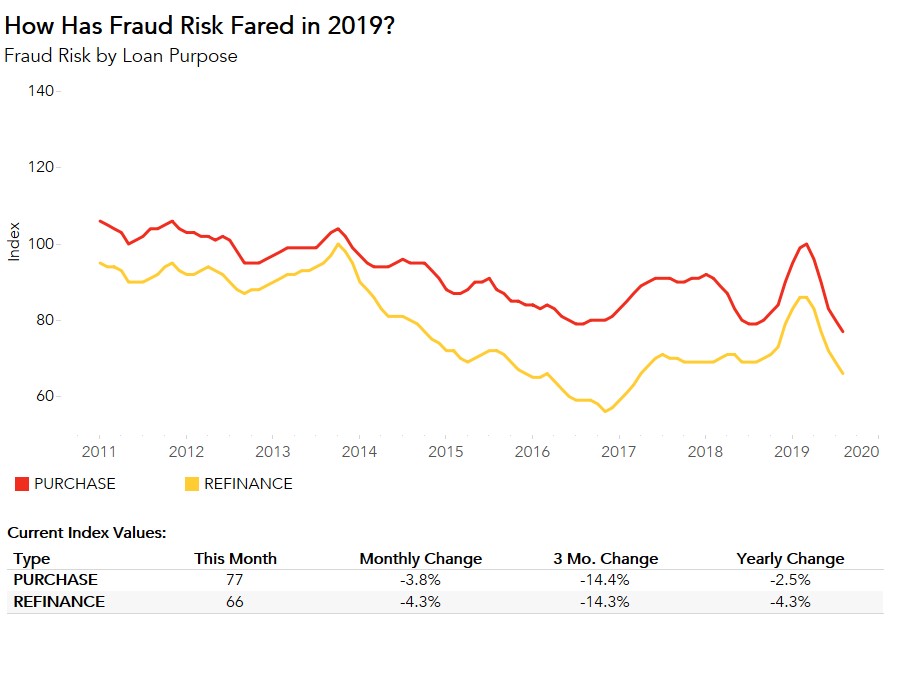
Declining for the fifth consecutive month, the Loan Application Defect Index for purchase transactions continued its downward trend, falling 3.8 percent in August compared with July. The Defect Index for refinance transactions also fell, declining 4.3 percent compared with the previous month. The overall Defect Index, which includes both purchase and refinance transactions, fell 3.9 percent compared with last month, and is 5.2 percent lower than one year ago.
“Stronger buyers’ market conditions and a rising share of refinance transactions – that’s what we need to maintain declining fraud risk momentum in 2019."
The overall Defect Index has not been this low since January 2017. However, falling defect risk is a recent phenomenon. In late 2018 and early 2019, overall defect risk rose at a fast pace and continued to do so until reaching a peak in February 2019. So, what sparked the slide in fraud risk in 2019?
Why is 2019 Different?
Between July 2018 and February 2019, the overall Defect Index increased 25 percent. And then, it stopped. In the second half of 2018, rising mortgage rates reduced the share of refinance transactions, leading to a greater share of higher-risk purchase transactions. Additionally, hurricanes and wildfires in the second half of 2018 contributed to climbing defect risk. Our research indicates natural disasters go hand-in-hand with rising loan application defect risk, as natural disasters create greater opportunity for misrepresentation of collateral condition.
But, 2019 provided a fresh start. In addition to fewer natural disasters, there are two primary reasons why 2019 has been the year of declining fraud risk.
1. Market Dynamics Shift Toward Buyers
Following the strong sellers’ market conditions throughout 2018, market dynamics shifted slightly toward buyers in 2019. Mortgage rates began to decline in January 2019 and are 0.8 percentage points lower in August than January. Meanwhile, household income, the other component of house-buying power, has continued to increase, rising 1.5 percent in August compared with January 2019. Falling mortgage rates and rising household income have boosted consumer house-buying power. On the supply side, while inventory remains tight, there has been some progress compared with 2018.
House-buying power gains and improvements in inventory tilt the market toward the buyer. But, what is the connection to fraud risk? Potential home buyers feel less pressure to misrepresent information on a loan application when strong sellers’ market conditions wane, as the market is less competitive.
2. Increase in the Share of Refinances
For many homeowners, the most important consideration when deciding to refinance is whether the mortgage rate is sufficiently lower than their existing rate. The 30-year, fixed-rate mortgage in August averaged 3.6 percent, the lowest since October 2016. According to estimates, 11.6 million existing households would be refinancing candidates at a mortgage rate of 3.5 percent, compared with just 2.9 million households when the mortgage rate is 4.5 percent.
As a result of lower rates, refinance applications are up 148 percent compared with one year ago, according to the latest MBA mortgage applications survey. Defect, fraud and misrepresentation risk is significantly lower on refinance transactions, so the reduced risk of fraud and misrepresentation in 2019, and August in particular, is largely due to the increasing share of lower risk refinance transactions within the mortgage market.
Will Buyers’ or Sellers’ Market Conditions Change Fraud Risk Outlook?
Housing market conditions and fewer natural disasters have created a declining fraud risk environment in 2019, so far. However, lower mortgage rates and higher incomes typically result in more demand for homes. While inventory has made some gains, it has mostly been for higher priced homes. The supply for lower- and middle-priced homes remains tight.
Increasing demand against limited supply means that the housing market could be poised for another strong sellers’ market, which could create a spike in fraud risk. The good news is that mortgage rates fell further in September, indicating even more refinances may be on the way. Stronger buyers’ market conditions and a rising share of refinance transactions – that’s what we need to maintain declining fraud risk momentum in 2019.
For Mark’s full analysis on loan defect risk, please visit the Loan Application Defect Index.
The Defect Index is updated monthly with new data. Look for the next edition of the Defect Index the week of October 28, 2019.
August 2019 Loan Application Defect Index
The First American Loan Application Defect Index showed that in August 2019:
- The frequency of defects, fraudulence and misrepresentation in the information submitted in mortgage loan applications decreased by 3.9 percent compared with the previous month.
- Compared to August 2018, the Defect Index decreased by 5.2 percent.
- The Defect Index is down 28.3 percent from the high point of risk in October 2013.
- The Defect Index for refinance transactions decreased by 4.3 percent compared with the previous month, and decreased by 4.3 percent compared with a year ago.
- The Defect Index for purchase transactions decreased by 3.8 percent compared with the previous month, and is down 2.5 percent compared with a year ago.
August 2019 State Highlights
- The five states with a year-over-year increase in defect frequency are: Nebraska (+23.2 percent), Iowa (+17.6 percent), South Dakota (+13.9 percent), New York (+12.8 percent), and North Dakota (+8.4 percent).
- The five states with a year-over-year decrease in defect frequency are: Florida (-16.7 percent), Delaware (-13.8 percent), Texas (-13.8 percent), Vermont (-12.5 percent), and Maryland (-11.7 percent).
August 2019 Local Market Highlights
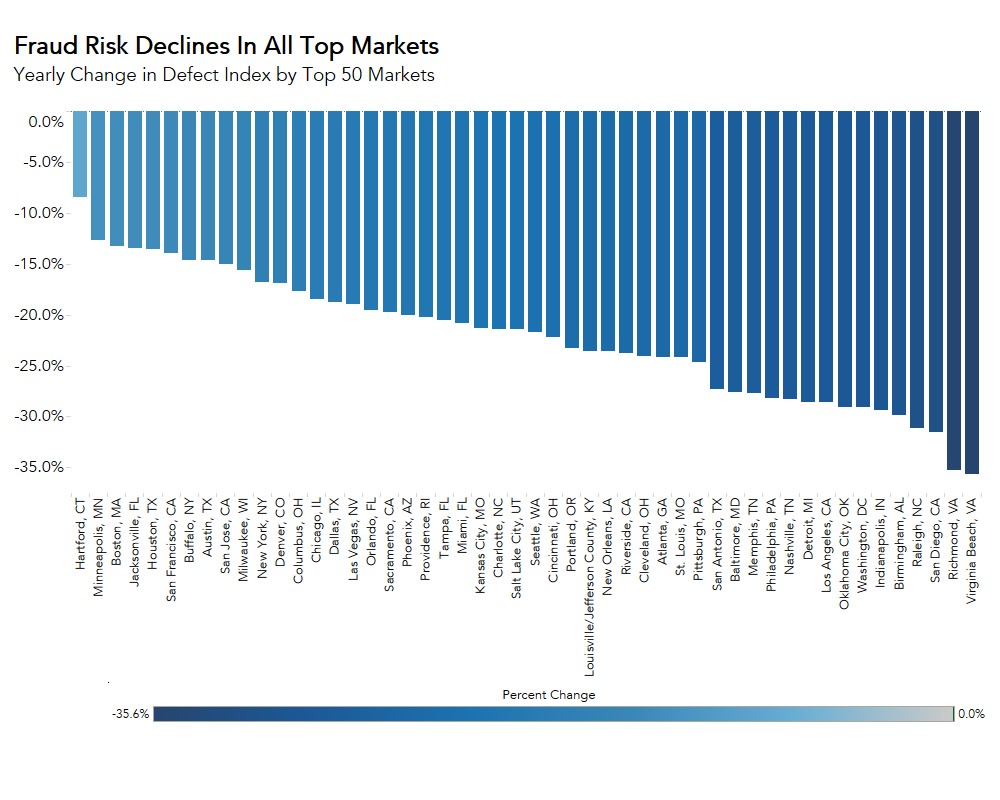
- Among the largest 50 Core Based Statistical Areas (CBSAs), the five markets with the greatest year-over-year increase in defect frequency are: Buffalo, N.Y. (+8.6 percent), Kansas City, Mo. (+6.8 percent), New York (+5.2 percent), Hartford, Conn. (+3.1 percent), and San Jose, Calif. (+2.9 percent).
- Among the largest 50 Core Based Statistical Areas (CBSAs), the five markets with the greatest year-over-year decrease in defect frequency are: Houston (-22.7 percent), San Diego (-21.2 percent), Orlando, Fla. (-20.9 percent), Jacksonville, Fla. (-20.2 percent), and Tampa, Fla. (-18.4 percent).
Methodology
The First American Loan Application Defect Index estimates the level of defects detected in the information submitted in mortgage loan applications processed by the First American FraudGuard® system. The index is based on the frequency with which defect indicators are identified. The Defect Index moves higher as greater numbers of defect indicators are identified. An increase in the index indicates a rising level of loan application defects. The index, nationally and in all markets, is benchmarked to a value of 100 in January 2011. Therefore, all index values can be interpreted as the percentage change in defect frequency relative to the defect frequency identified nationally in January 2011.