Our Potential Home Sales Model, which measures what a healthy market for home sales should be based on the economic, demographic and housing market environments, increased by 1 percent in July, but remains nearly 2 percent lower than one year ago. The yearly decline in market potential was the smallest since February 2022. The steep decline in sales driven by the rapid rise in mortgage rates seems to be behind us, as the initial shock of higher mortgage rates has worn off. While there was a modest monthly increase in market potential, existing-home sales will have a tough time gaining real momentum in a limited inventory environment where most homeowners are rate-locked into their homes – you can’t buy what’s not for sale.
“For the remainder of 2023, existing-home sales may experience relative growth, particularly if mortgage rates fall, but it will be difficult to have a meaningful increase in sales without more existing-home inventory.”
The Main Force Impeding Market Potential
The housing market is unique because existing homeowners influence both the demand and supply side of the market. Historically, existing homes have made up nearly 90 percent of total sales and inventory. If existing homeowners don’t sell, there’s very little to buy. According to first quarter 2023 National Mortgage Database data, more than 90 percent of homeowners were locked into rates below 6 percent. Why would anyone sell their home and get a new, higher rate mortgage when it will cost more each month to borrow the same amount from the bank?
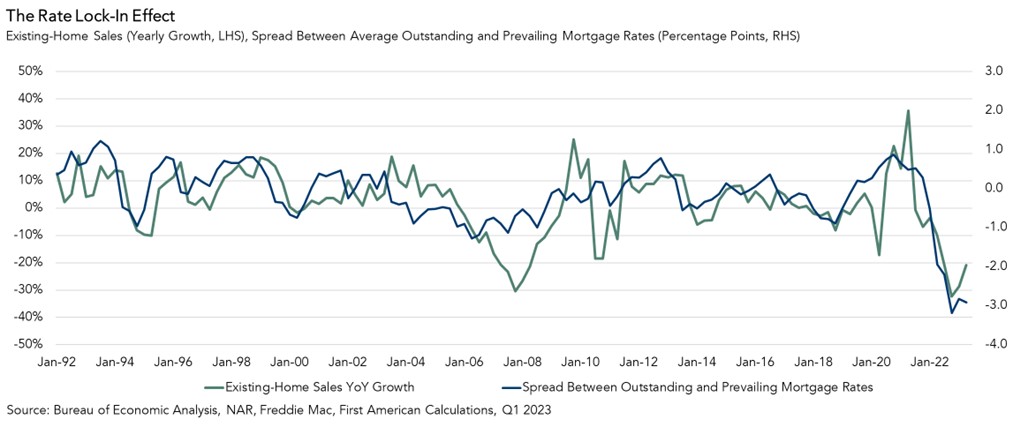
The strength of this rate lock-in effect can be estimated using the difference between the average rate for all outstanding mortgages and the prevailing market mortgage rate. As the prevailing market mortgage rate rises further and further above the average rate for all outstanding mortgages, the greater number of existing homeowners are rate-locked in. Today, more than at any other point in the last 30 years, homeowners have very little financial incentive to sell their home.
But Life Happens…
Of course, the decision to buy and sell is more than just a financial calculation. An existing homeowner may choose to sell for lifestyle reasons, even if it means losing their low mortgage rate. Additionally, 42 percent of homeowners own their home free-and-clear, so they’re unimpeded by the rate lock-in effect. Finally, homeowners have gained substantial equity in their homes as house prices soared over the course of the pandemic. For some of those equity-rich homeowners, moving and taking on a higher interest rate isn’t a huge deal, especially if they are moving to a more affordable place. For the remainder of 2023, existing-home sales may experience relative growth, particularly if mortgage rates fall, but it will be difficult to have a meaningful increase in sales without more existing-home inventory, even with these mitigating factors.
July 2023 Potential Home Sales
For the month of July, First American updated its proprietary Potential Home Sales Model to show that:
- Potential existing-home sales increased to a 5.36 million seasonally adjusted annualized rate (SAAR), a 1.0 percent month-over-month increase.
- This represents a 53.7 percent increase from the market potential low point reached in February 1993.
- The market potential for existing-home sales decreased 1.9 percent compared with a year ago, a loss of 102,116 (SAAR) sales.
- Currently, potential existing-home sales is 1,432,275 (SAAR), or 21.1 percent, below the peak of market potential, which occurred in April 2006.
First American Deputy Chief Economist Odeta Kushi contributed to this post.
What Insight Does the Potential Home Sales Model Reveal?
When considering the right time to buy or sell a home, an important factor in the decision should be the market’s overall health, which is largely a function of supply and demand. Knowing how close the market is to a healthy level of activity can help consumers determine if it is a good time to buy or sell, and what might happen to the market in the future. That is difficult to assess when looking at the number of homes sold at a particular point in time without understanding the health of the market at that time. Historical context is critically important. Our potential home sales model measures what a healthy market for home sales should be based on the economic, demographic and housing market environments.
About the Potential Home Sales Model
Potential home sales measures existing-home sales, which include single-family homes, townhomes, condominiums and co-ops on a seasonally adjusted annualized rate based on the historical relationship between existing-home sales and U.S. population demographic data, homeowner tenure, house-buying power in the U.S. economy, price trends in the U.S. housing market, and conditions in the financial market. When the actual level of existing-home sales are significantly above potential home sales, the pace of turnover is not supported by market fundamentals and there is an increased likelihood of a market correction. Conversely, seasonally adjusted, annualized rates of actual existing-home sales below the level of potential existing-home sales indicate market turnover is underperforming the rate fundamentally supported by the current conditions. Actual seasonally adjusted annualized existing-home sales may exceed or fall short of the potential rate of sales for a variety of reasons, including non-traditional market conditions, policy constraints and market participant behavior. Recent potential home sale estimates are subject to revision to reflect the most up-to-date information available on the economy, housing market and financial conditions. The Potential Home Sales model is published prior to the National Association of Realtors’ Existing-Home Sales report each month.


