Our Potential Home Sales Model, which measures what a healthy market for home sales should be based on the economic, demographic and housing market environments, increased modestly in May, but is still down 5.7 percent from a year ago. The primary factor limiting housing market potential is existing homeowners staying put.
“In a higher mortgage rate environment, where many existing homeowners stay put and limit the supply of homes for sale, housing market potential will remain constrained. As a result, the new normal for existing-home sales will be lower than during the pandemic boom years.”
Traditionally, existing homes make up nearly 90 percent of the total inventory of homes for sale nationally. Since the start of the pandemic, existing homes have made up on average 75 percent of all homes for sale. In April, the most recent data available, that share fell further to 71 percent. The persistent lack of existing-home inventory holds back housing market potential. You can’t buy what’s not for sale.
Existing Homes, A Scarce Good
One way to measure existing-home inventory is to track inventory turnover – the supply of existing homes for sale as a percentage of the total occupied residential inventory. Prior to the start of the pandemic in February 2020, existing-home inventory averaged 2.2 percent. In other words, 220 in every 10,000 existing homes were for sale. Inventory turnover hit a historic low of 0.77 percent in February 2022 and has made little progress since then. As of the most recent data available in April 2023, approximately 84 homes in every 10,000 were for sale, well below the historic average.
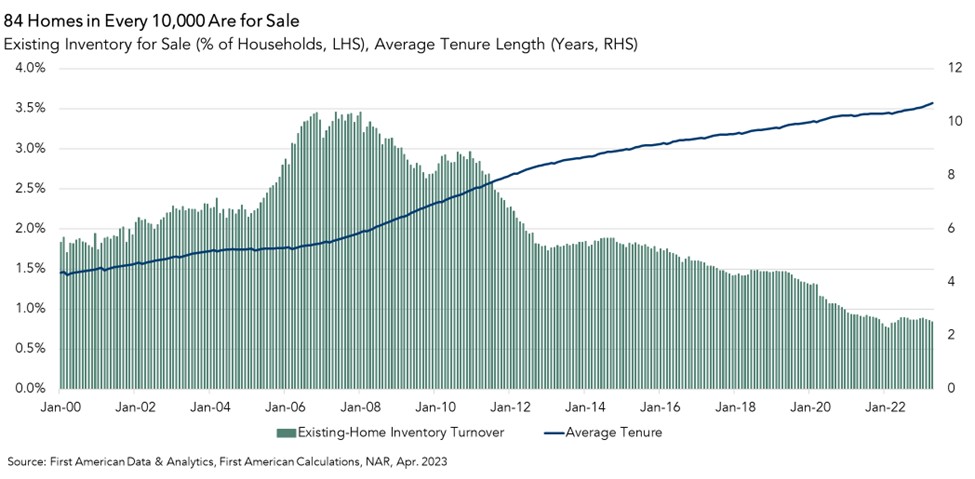
Rising tenure length, a measure of the time someone lives in their home, can help to explain why existing-home inventory remains so constrained. Before the housing market crash in 2007, the average length of time someone lived in their home was approximately five years. Average tenure length grew to approximately eight years during the aftermath of the housing market crisis between 2008 and 2016, in part because homeowners who were underwater on their mortgage needed to wait for their home to appreciate before they sold.
The most recent data shows that the average length of time someone lives in their home reached a record high of 10.8 years in May 2023. One of the primary reasons that tenure has increased is due to the higher mortgage rate environment. Higher mortgage rates keep existing homeowners feeling rate-locked into their homes. Additionally, existing owners are reluctant to sell because they don’t think they can find a better home to buy in a limited inventory market.
Will Existing-Home Inventory Rise?
Despite the headwinds facing the housing market today, it’s important to note that the decision to buy and sell is more than just a financial calculation. An existing homeowner may choose to sell for lifestyle reasons, even if it means losing their low mortgage rate. Additionally, 42 percent of homeowners own their home free-and-clear, so they are not deterred by higher mortgage rates. Finally, existing homeowners are sitting on near historic levels of equity. For some of those equity-rich homeowners, moving and taking on a higher interest rate may not hinder their decision to sell – especially if they move to a more affordable place. Yet, in a higher mortgage rate environment where existing homeowners stay put and limit the supply of homes for sale, housing market potential will remain constrained. As a result, the new normal for existing-home sales will be lower than during the pandemic boom years.
While recency bias may have caused many to forget, the pace of sales in late 2020 and 2021, which averaged over 6 million at a seasonally adjusted annualized rate (SAAR) of sales, was anything but normal. The pre-pandemic historic average pace of sales is closer to 5 million SAAR and, while the housing market today remains below that level, it is primarily a reflection of the historically low levels of inventory.
May 2023 Potential Home Sales
For the month of May, First American updated its proprietary Potential Home Sales Model to show that:
- Potential existing-home sales increased to a 5.30 million seasonally adjusted annualized rate (SAAR), a 0.19 percent month-over-month increase.
- This represents a 52.1 percent increase from the market potential low point reached in February 1993.
- The market potential for existing-home sales decreased 5.7 percent compared with a year ago, a loss of 319,000 (SAAR) sales.
- Currently, potential existing-home sales is 1,486,600 (SAAR), or 21.9 percent, below the peak of market potential, which occurred in April 2006.
First American Deputy Chief Economist Odeta Kushi contributed to this post.
What Insight Does the Potential Home Sales Model Reveal?
When considering the right time to buy or sell a home, an important factor in the decision should be the market’s overall health, which is largely a function of supply and demand. Knowing how close the market is to a healthy level of activity can help consumers determine if it is a good time to buy or sell, and what might happen to the market in the future. That is difficult to assess when looking at the number of homes sold at a particular point in time without understanding the health of the market at that time. Historical context is critically important. Our potential home sales model measures what a healthy market for home sales should be based on the economic, demographic and housing market environments.
About the Potential Home Sales Model
Potential home sales measures existing-home sales, which include single-family homes, townhomes, condominiums and co-ops on a seasonally adjusted annualized rate based on the historical relationship between existing-home sales and U.S. population demographic data, homeowner tenure, house-buying power in the U.S. economy, price trends in the U.S. housing market, and conditions in the financial market. When the actual level of existing-home sales are significantly above potential home sales, the pace of turnover is not supported by market fundamentals and there is an increased likelihood of a market correction. Conversely, seasonally adjusted, annualized rates of actual existing-home sales below the level of potential existing-home sales indicate market turnover is underperforming the rate fundamentally supported by the current conditions. Actual seasonally adjusted annualized existing-home sales may exceed or fall short of the potential rate of sales for a variety of reasons, including non-traditional market conditions, policy constraints and market participant behavior. Recent potential home sale estimates are subject to revision to reflect the most up-to-date information available on the economy, housing market and financial conditions. The Potential Home Sales model is published prior to the National Association of Realtors’ Existing-Home Sales report each month.


