First American’s proprietary Loan Application Defect Index examines January 2018 data on the frequency of defects, fraudulence and misrepresentation in the information submitted in mortgage loan applications.
January 2018 Loan Application Defect Index
The First American Loan Application Defect Index showed that in January 2018:
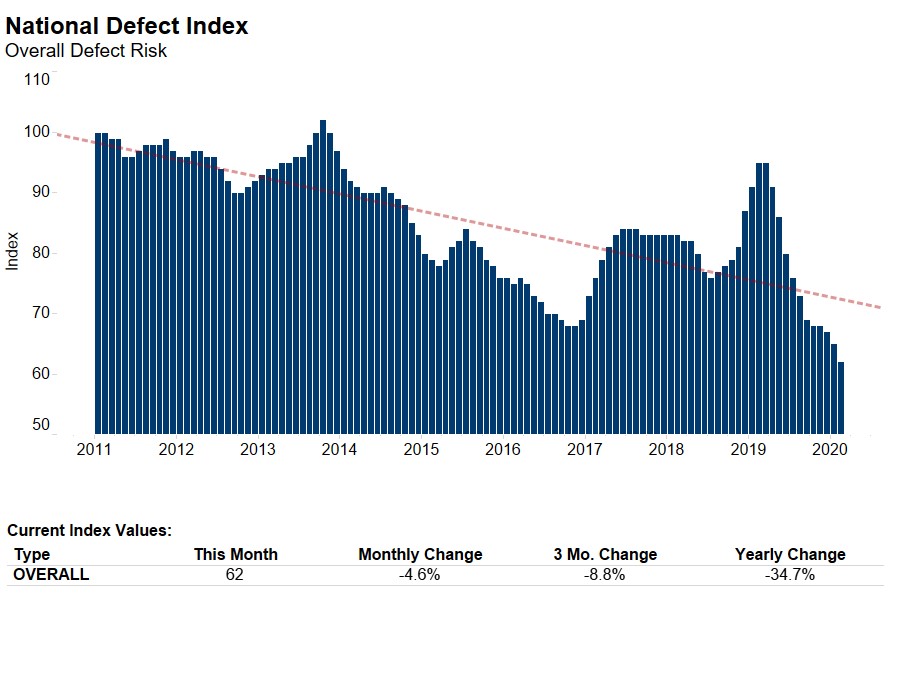
- The frequency of defects, fraudulence and misrepresentation in the information submitted in mortgage loan applications remained the same compared with the previous month.
- Compared with January 2017, the Defect Index increased by 13.7 percent.
- The Defect Index is down 18.6 percent from the high point of risk in October 2013.
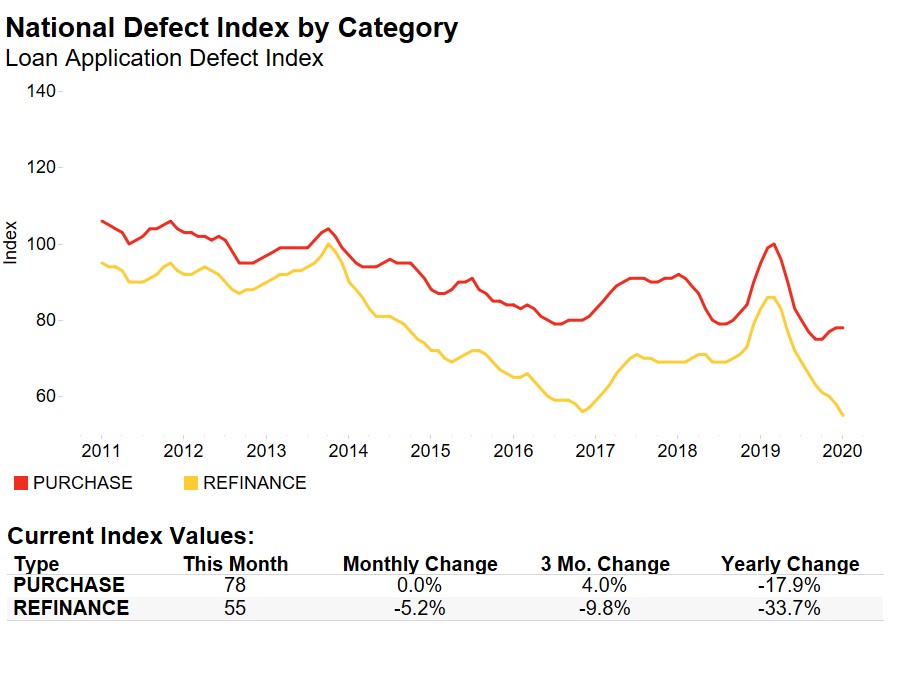
- The Defect Index for refinance transactions remained unchanged compared with the previous month, and is 16.9 percent higher than a year ago.
- The Defect Index for purchase transactions increased by 1.1 percent compared with the previous month, and is up 10.8 percent compared with a year ago.
"The overall defect, fraud and misrepresentation risk index remained unchanged, however, the index for purchase transactions increased in January,” said Mark Fleming, chief economist at First American. “While misrepresentation and manufacturing defects can happen on either purchase or refinance transactions, there is a greater propensity for fraud with purchase transactions. The uptick in defect frequency in purchase transactions in January is an indication of heightened fraud risk.”
High Risk in Florida High Rises
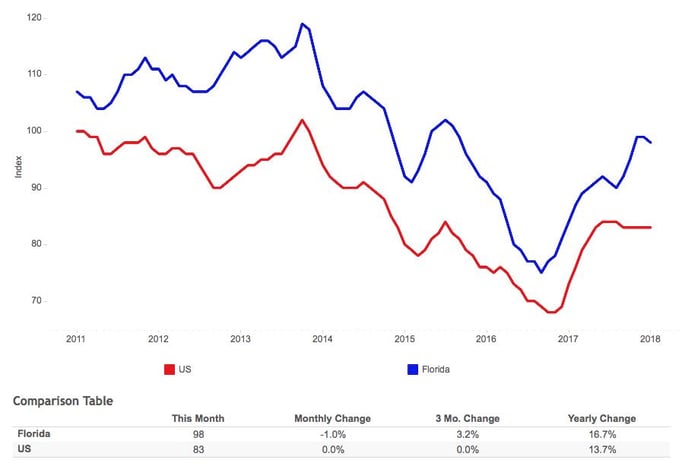
- Florida is currently the third riskiest state according to the defect, fraud and misrepresentation risk index, and by far the largest state among the five most risky. The other states in the top five are Arkansas, Idaho, Wyoming and North Dakota.
- While overall defect, fraud and misrepresentation risk in the U.S. has remained stable for five consecutive months, defect risk in Florida has been on the rise, increasing 6.5 percent since September 2017.
- This may be partly driven by the popularity of high-rise condominiums in Florida’s large coastal metropolitan areas. Condominiums are the only property type for which defect, fraud and misrepresentation risk has increased in the last three months, up 1.1 percent nationally.
"High-rise condominiums in coastal Florida markets were home to the highest risk of loan application defects, fraud and misrepresentation in January."
“As the risk of fraudulent purchase transactions rises, understanding where risk lies is important,” said Fleming. “Florida is one of the largest markets in the country with concentrations of condominiums in the large coastal markets. The combination of size and rising defect, fraud, and misrepresentation risk in condominiums, makes Florida an important market to watch.”
January 2018 State Highlights
- The five states with the greatest year-over-year increase in defect frequency are: South Dakota (+39.7 percent), New Mexico (+29.9 percent), Wyoming (+24.4 percent), Oregon (+23.9 percent) and Ohio (+23.1 percent).
- There are two states with a year-over-year decrease in defect frequency: Connecticut (-4.3 percent) and Louisiana (-3.4 percent).
January 2018 Local Market Highlights
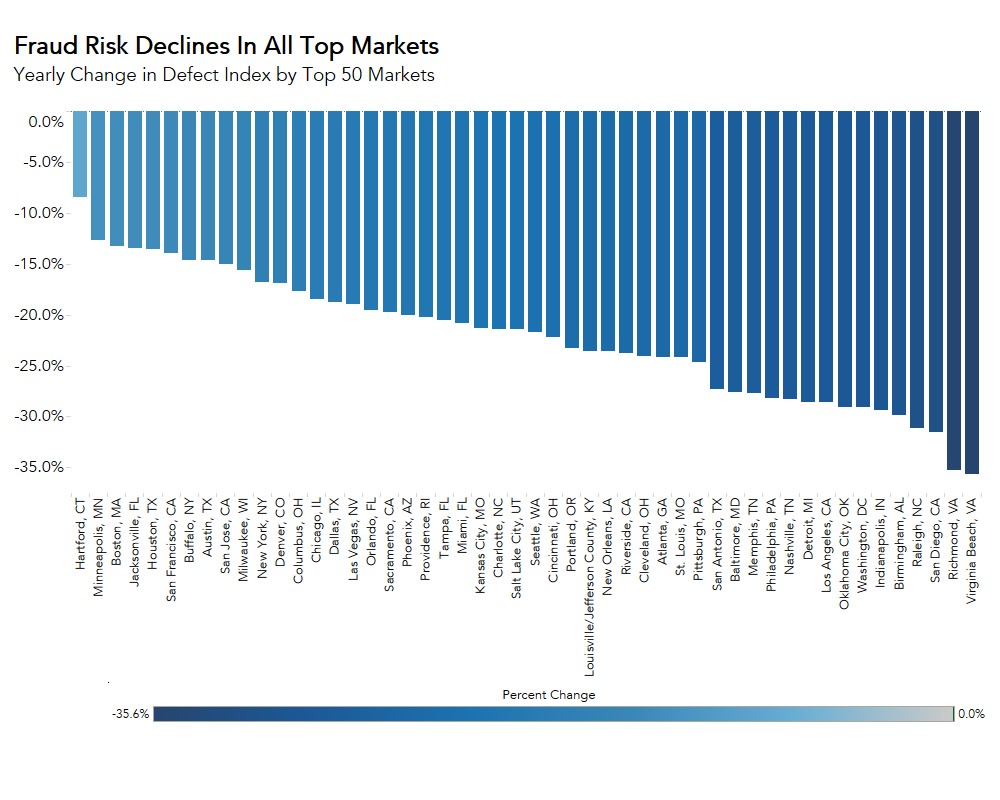
- Among the largest 50 Core Based Statistical Areas (CBSAs), the five markets with the greatest year-over-year increase in defect frequency are: Oklahoma City (+29.6 percent), Virginia Beach, Va. (+26.9 percent), Miami (+25.3 percent), Orlando, Fla. (+24.7 percent), and Cleveland (+23.9 percent).
- Among the largest 50 CBSAs, the three markets with a year-over-year decrease in defect frequency are: Hartford, Conn. (-3.1 percent), Minneapolis (-2.6 percent), and Raleigh, N.C. (-2.5 percent).
Next Release
The next release of the First American Loan Application Defect Index will take place the week of March 26, 2018.
Methodology
The First American Loan Application Defect Index estimates the level of defects detected in the information submitted in mortgage loan applications processed by the First American FraudGuard© system. The index is based on the frequency with which defect indicators are identified. The Defect Index moves higher as greater numbers of defect indicators are identified. An increase in the index indicates a rising level of loan application defects. The index, nationally and in all markets, is benchmarked to a value of 100 in January 2011. Therefore, all index values can be interpreted as the percentage change in defect frequency relative to the defect frequency identified nationally in January 2011.


