In July 2023, the Real House Price Index (RHPI) jumped up by nearly 17 percent on an annual basis, bringing housing affordability to the lowest point in over three decades. Two factors drove the sharp annual decline in affordability – a 4 percent annual increase in nominal house prices and a 1.4 percentage point increase in the 30-year, fixed mortgage rate compared with one year ago. For home buyers, holding prices constant, the only way to mitigate the loss of affordability caused by higher mortgage rates is with an equivalent, if not greater, increase in household income. Even though household income increased 3.7 percent since July 2022 and boosted consumer house-buying power, it was not enough to offset the affordability loss from higher rates and rising nominal prices.
“Lower nominal house prices, lower mortgage rates, higher incomes, or some combination of the three are the only ways to bring more affordability to the housing market.”
The median sale price of an existing home in July, according to data from First American Data & Analytics, was approximately $345,000, while the median house-buying power was nearly $337,000. If housing is appropriately valued, house-buying power should equal or outpace the median sale price of a home. While the national housing market is overvalued by this measure, applying the same analysis at the market level confirms how different housing market dynamics can be from one market to the next.
Where is Housing Overvalued?
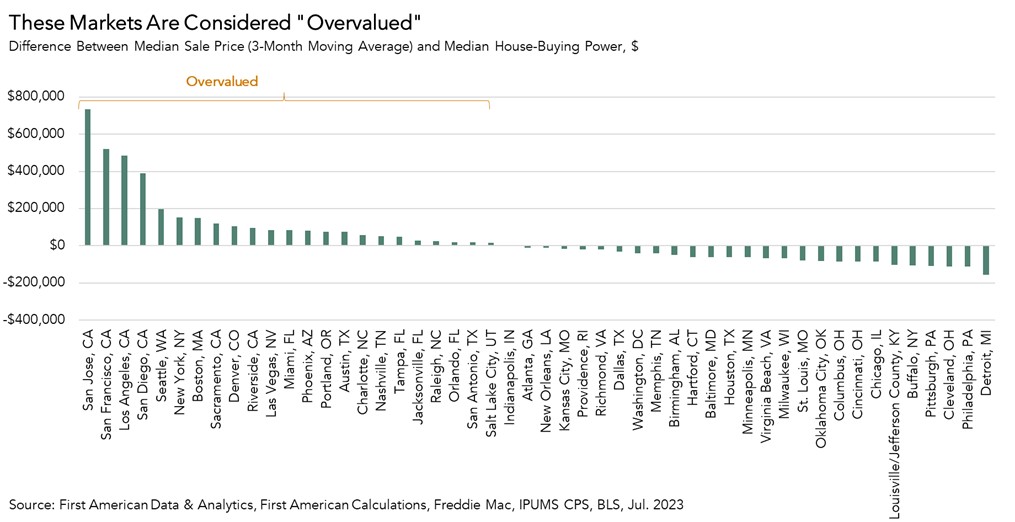
Of the top 50 markets tracked, 24 markets were overvalued in July, meaning the median existing-home sale price exceeded house-buying power. This is significantly higher than in July 2022, when just 15 markets were considered overvalued. The most overvalued market in July was San Jose, Calif., where the median sale price of a home was nearly $1,440,000, approximately double the level of consumer house-buying power of $700,000. Moving down the overvaluation list, San Francisco and Los Angeles were also overvalued, although to a lesser extent. While house prices had been declining from last year’s peak in these markets, they have since re-accelerated. Despite being considered overvalued, the housing supply shortage is preventing prices from adjusting downward to reflect current affordability levels.
The good news is that most of the markets we track remain undervalued by this measure, and some markets remain significantly undervalued. For example, Detroit, Philadelphia and Cleveland are undervalued by an average of $126,000.
Where Does the Housing Market Go from Here?
Housing overvaluation is a function of three factors: nominal house prices, household income, and mortgage rates. First American Data & Analytics preliminary nominal house price index indicates that house price appreciation likely continued in August. Meanwhile, median household incomes are expected to continue to rise, as the supply and demand imbalance in the labor market persists, putting upward pressure on wages. Finally, while mortgage rates may fluctuate, they are generally expected to stabilize, if the Federal Reserve signals a pause in rate hikes is near. The outlook for affordability will depend on the tug-of-war between these factors. Lower nominal house prices, lower mortgage rates, higher incomes, or some combination of the three are the only ways to bring more affordability to the housing market.
For more analysis of affordability, please visit the Real House Price Index. The RHPI is updated monthly with new data. Look for the next edition of the RHPI the week of October 30, 2023.
Sources:
July 2023 Real House Price Index Highlights
The First American Real House Price Index (RHPI) showed that in July 2023:
- Real house prices increased 2.0 percent between June 2023 and July 2023.
- Real house prices increased 16.9 percent between July 2022 and July 2023.
- Consumer house-buying power, how much one can buy based on changes in income and mortgage rates, decreased 1.0 percent between June 2023 and July 2023, and decreased 11.0 percent year over year.
- Median household income has increased 3.7 percent since July 2022 and 83.2 percent since January 2000.
- Real house prices are 43.9 percent more expensive than in January 2000.
- Unadjusted house prices are now 53.7 percent above the housing boom peak in 2006, while real, house-buying power-adjusted house prices are 0.7 percent above their 2006 housing boom peak.
July 2023 Real House Price State Highlights
- The five states with the greatest year-over-year increase in the RHPI are: Maine (+27.8 percent), Connecticut (+27.0 percent), Indiana (+25.3 percent), Alaska (+24.6 percent), and Virginia (+23.9 percent).
- There were no states with a year-over-year decrease in the RHPI.
July 2023 Real House Price Local Market Highlights
- Among the Core Based Statistical Areas (CBSAs) tracked by First American, the five markets with the greatest year-over-year increase in the RHPI are: Indianapolis (+25.2 percent), Chicago (+25.2 percent), San Diego (+25.2 percent), Buffalo, N.Y. (+24.6 percent), and Miami (+24.5 percent).
- Among the Core Based Statistical Areas (CBSAs) tracked by First American, there were no markets with a year-over-year decrease in the RHPI.
About the First American Real House Price Index
The traditional perspective on house prices is fixated on the actual prices and the changes in those prices, which overlooks what matters to potential buyers - their purchasing power, or how much they can afford to buy. First American’s proprietary Real House Price Index (RHPI) adjusts prices for purchasing power by considering how income levels and interest rates influence the amount one can borrow.
The RHPI uses a weighted repeat-sales house price index that measures the price movements of single-family residential properties by time and across geographies, adjusted for the influence of income and interest rate changes on consumer house-buying power. The index is set to equal 100 in January 2000. Changing incomes and interest rates either increase or decrease consumer house-buying power. When incomes rise and mortgage rates fall, consumer house-buying power increases, acting as a deflator of increases in the house price level. For example, if the house price index increases by three percent, but the combination of rising incomes and falling mortgage rates increase consumer buying power over the same period by two percent, then the Real House Price index only increases by 1 percent. The Real House Price Index reflects changes in house prices, but also accounts for changes in consumer house-buying power.
Disclaimer
Opinions, estimates, forecasts and other views contained in this page are those of First American’s Chief Economist, do not necessarily represent the views of First American or its management, should not be construed as indicating First American’s business prospects or expected results, and are subject to change without notice. Although the First American Economics team attempts to provide reliable, useful information, it does not guarantee that the information is accurate, current or suitable for any particular purpose. © 2023 by First American. Information from this page may be used with proper attribution.


