Housing affordability continued its rapid annual decline in July 2022, as nominal house prices increased 16.7 percent year over year and the 30-year, fixed mortgage rate increased 2.5 percentage points compared with a year ago. The decline in affordability is reflected in the Real House Price Index (RHPI) jumping up by nearly 54 percent on an annual basis. For home buyers, there are few options to mitigate the loss of affordability caused by a higher mortgage rate and rising prices. One way to offset the decline in affordability is with an equivalent, if not greater, increase in household income. Another option is choosing an adjustable-rate mortgage (ARM), which typically has a lower rate than a 30-year, fixed-rate mortgage. Even though higher household income and ARMs help to increase consumer house-buying power, they’re not enough to offset the affordability loss from higher rates and fast-rising nominal prices in July.
“While the markets considered overvalued may need to adjust to the not-so-new reality of higher mortgage rates, housing market fundamentals still support a moderation of annualized house price appreciation rather than a sharp decline.”
As affordability wanes, would-be buyers are pulling back from the market, prompting annual house price appreciation to moderate. Annual house price growth peaked in March at nearly 21 percent but has since decelerated to a still-high 16.7 percent in July. As the housing slowdown continues, the pace of house price moderation will vary market to market, with prices decelerating faster in some markets than in others. By analyzing which markets are considered overvalued, we can identify the markets at risk of more rapid price deceleration.
Where is Housing Overvalued?
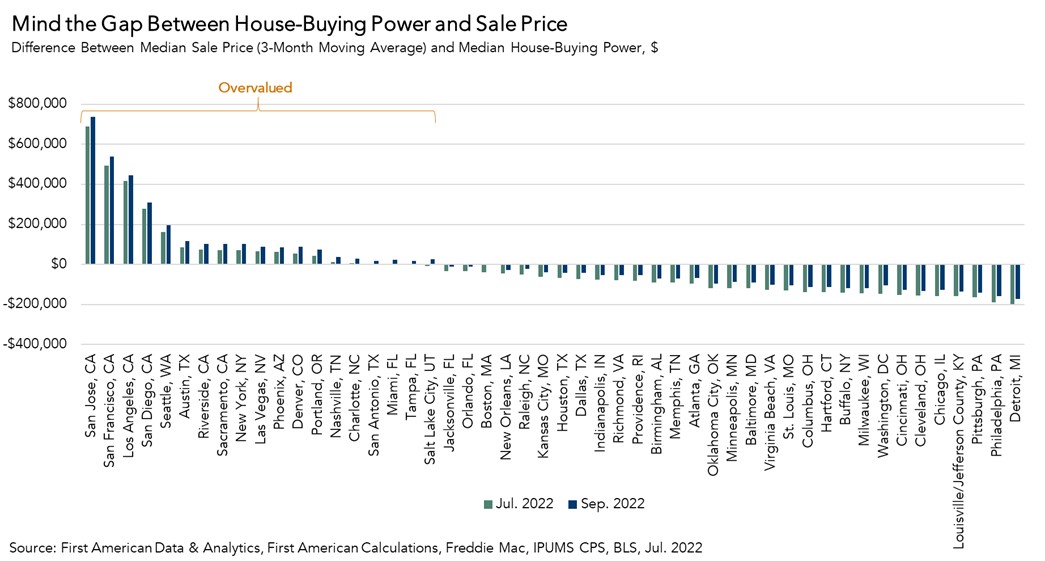
If housing is appropriately valued, house-buying power should equal or exceed the median sale price of a home. As of July, most of the top 50 markets we track remain undervalued by this measure, some significantly undervalued. For example, Detroit, Philadelphia, and Pittsburgh are markets considered undervalued by nearly $200,000.
However, real estate is local and not all markets are created equal. There were 15 markets considered overvalued in July, meaning the median existing-home sale price exceeded house-buying power. One year ago, only four markets were considered overvalued. San Jose, Calif. was the most overvalued market. The median consumer house-buying power in San Jose in July was just over $770,000, barely more than half of the median sale price of a home at $1,460,000. Consequently, annual house price growth is adjusting in San Jose. Price growth peaked at 19.4 percent in February 2022, but has since decelerated quickly to 4.6 percent in July – the second fastest deceleration in prices among all the top 50 markets we track, just after Sacramento.
Overvaluation was calculated based on July 2022 house prices and mortgage rates, but mortgage rates have drifted higher since then. If we hold household income and median sale prices constant at their July 2022 levels, the increase in the average 30-year, fixed mortgage rate from 5.4 percent in July to 6 percent in September, increases the number of overvalued markets by four, adding San Antonio, Miami, Tampa, Fla., and Salt Lake City to the list and bringing to the total to 19.
Where Does the Housing Market Go from Here?
Housing overvaluation is a function of three factors: house prices, household income, and mortgage rates. First American Data & Analytics’ preliminary nominal house price index indicates that house price deceleration is likely to continue in September. Meanwhile, median household incomes are expected to continue to rise, as the supply and demand imbalance in the labor market persists, putting upward pressure on wages. While mortgage rates are expected to continue to drift higher over the coming months, much of the rapid increase in rates is likely behind us. While the markets considered overvalued may need to adjust to the not-so-new reality of higher mortgage rates, housing market fundamentals still support a moderation of annualized house price appreciation rather than a sharp decline.
Nationally, while month-over-month house prices may decline, annual house price declines are not expected, given the ongoing supply-demand imbalance and continued strength in the labor market. Prior to the pandemic, the historical average for annual house price growth was just below 4 percent so, as the market adjusts to a not-so-new normal pace of appreciation, some buyers who backed out due to the frenzy of the super sellers’ market may jump back in.
For more analysis of affordability, please visit the Real House Price Index. The RHPI is updated monthly with new data. Look for the next edition of the RHPI the week of October 17, 2022.
Sources:
July 2022 Real House Price Index Highlights
The First American Real House Price Index (RHPI) showed that in July 2022:
- Real house prices decreased 0.9 percent between June 2022 and July 2022.
- Real house prices increased 53.8 percent between July 2021 and July 2022.
- Consumer house-buying power, how much one can buy based on changes in income and interest rates, increased 1.7 percent between June 2022 and July 2022, and decreased 24.1 percent year over year.
- Median household income has increased 3.0 percent since July 2021 and 76 percent since January 2000.
- Real house prices are 28.7 percent more expensive than in January 2000.
- While unadjusted house prices are now 55.1 percent above the housing boom peak in 2006, real, house-buying power-adjusted house prices remain 9.3 percent below their 2006 housing boom peak.
July 2022 Real House Price State Highlights
- The five states with the greatest year-over-year increase in the RHPI are: Florida (+72.2), South Carolina (+59.6 percent), Georgia (+59.4), North Carolina (+58.5 percent), and Vermont (+58.2 percent).
- There were no states with a year-over-year decrease in the RHPI.
July 2022 Real House Price Local Market Highlights
- Among the Core Based Statistical Areas (CBSAs) tracked by First American, the five markets with the greatest year-over-year increase in the RHPI are: Miami (+68.5 percent), Tampa, Fla. (+67.3 percent), Charlotte, N.C. (+65.1), Raleigh, N.C. (+64.1 percent), and Orlando (+62.5 percent).
- Among the Core Based Statistical Areas (CBSAs) tracked by First American, there were no markets with a year-over-year decrease in the RHPI.
About the First American Real House Price Index
The traditional perspective on house prices is fixated on the actual prices and the changes in those prices, which overlooks what matters to potential buyers - their purchasing power, or how much they can afford to buy. First American’s proprietary Real House Price Index (RHPI) adjusts prices for purchasing power by considering how income levels and interest rates influence the amount one can borrow.
The RHPI uses a weighted repeat-sales house price index that measures the price movements of single-family residential properties by time and across geographies, adjusted for the influence of income and interest rate changes on consumer house-buying power. The index is set to equal 100 in January 2000. Changing incomes and interest rates either increase or decrease consumer house-buying power. When incomes rise and mortgage rates fall, consumer house-buying power increases, acting as a deflator of increases in the house price level. For example, if the house price index increases by three percent, but the combination of rising incomes and falling mortgage rates increase consumer buying power over the same period by two percent, then the Real House Price index only increases by 1 percent. The Real House Price Index reflects changes in house prices, but also accounts for changes in consumer house-buying power.
Disclaimer
Opinions, estimates, forecasts and other views contained in this page are those of First American’s Chief Economist, do not necessarily represent the views of First American or its management, should not be construed as indicating First American’s business prospects or expected results, and are subject to change without notice. Although the First American Economics team attempts to provide reliable, useful information, it does not guarantee that the information is accurate, current or suitable for any particular purpose. © 2022 by First American. Information from this page may be used with proper attribution.


