Though the industrial market is softening compared to the pandemic days of double-digit rent growth and record-low vacancy, it is far from weak. Despite slowing rent growth and modestly rising vacancies, demand to lease industrial space remains strong, driven by long-term trends such as rising eCommerce sales, retailers’ need for modern logistics and distribution capabilities, and generative AI-driven demand for computing power in data centers.
These softer dynamics have contributed to an increase in industrial cap rates. Our Industrial Potential Cap Rate (PCR) model – which estimates a cap rate based on underlying market fundamentals, such as eCommerce sales, construction starts, vacancies, and commercial mortgage flows – increased by 0.4 percentage points in the fourth quarter of 2023 compared to the third quarter. Compared to a year ago, the Industrial PCR has increased by 1.3 percentage points, a meaningful increase, but relative to the all-time low industrial cap rate. The primary cause of this increase over the last year is higher vacancy rates due to more deliveries of industrial space and fewer construction starts.
“While the industrial market may soften further this year, the long-term demand dynamics for industrial space remain strong, and once the current supply pipeline drains further, demand will rebalance with supply.”
Construction as a Measure of Both Supply and Demand
Long-term demand drivers, combined with record-low interest rates and a surge in eCommerce purchasing during the pandemic, drove industrial construction to a record high in the third quarter of 2022. That new construction resulted in an all-time peak in industrial deliveries of roughly 150 million square feet in the third quarter of 2023. These new deliveries, the “back-end” of the construction process, are a measure of new supply.
By contrast, construction starts represent the “front-end” of the construction process and are a measure of demand to own industrial properties. Where there is a greater desire to own industrial properties, developers are more incentivized to begin new construction projects. As “back-end” deliveries have come to market, “front-end” demand has fallen. Construction starts are slowing down because of a combination of higher interest rates, construction costs, and concern over the ability of the market to absorb upcoming “back-end” deliveries.
What's a Tub Got to Do with it?
The relationship between starts, deliveries and under-construction stock can be explained with a simple analogy. Consider a bathtub. Water flowing into the tub (construction starts) increases the amount of water in the bathtub (the stock of square footage under construction). Water flowing out of the tub down the faucet (deliveries) decreases that stock. When water flows in faster than it’s flowing out, the bathtub accumulates more water. Similarly, when starts outpace deliveries, under-construction stock (the future supply pipeline) increases, and vice versa.
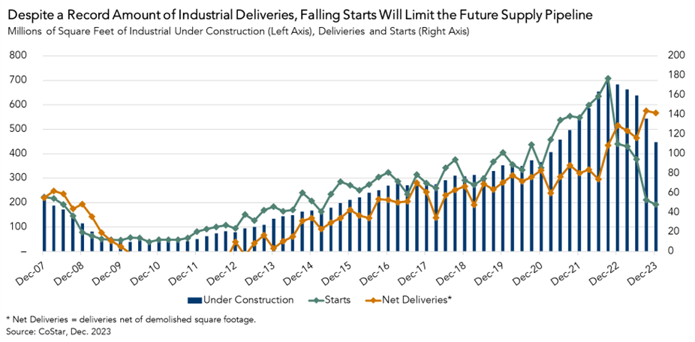
Since the Global Financial Crisis (GFC) until the third quarter of 2022, demand as measured by construction starts has outpaced supply (net deliveries). However, beginning in the fourth quarter of 2022, deliveries of that record-breaking stock of space under construction has outpaced starts. As of the fourth quarter of 2023, there was more than 90 million more square feet of space delivered than there were new construction starts, the first time since before the GFC.
Tenants Have Options
For now, industrial supply is outpacing demand. As a result, there will be more choices for industrial tenants in 2024. But, after this new space is leased up, there will be fewer options coming to market in 2025 and 2026. While the industrial market may soften further this year, the long-term demand dynamics for industrial space remain strong, and once the current supply pipeline drains further, demand will rebalance with supply.
Fourth Quarter 2023 Industrial Potential Cap Rate Model
- The industrial PCR was 6.3 percent, an increase of 0.4 percentage points as compared with the third quarter of 2023.
- The industrial PCR increased by 1.3 percentage points as compared with one year ago.
Industrial Cap Rate Outlook Gap
- The gap between the actual industrial cap rate and the industrial PCR provides insight into the likelihood of shifts in the actual cap rate. If the industrial PCR is below the actual industrial cap rate, it indicates that fundamentals supported lower cap rates than were observed. If the industrial PCR is above the actual industrial cap rate, it indicates that fundamentals supported higher cap rates than were observed.
- In the fourth quarter of 2023, the actual national industrial cap rate of 6.1 percent was 0.2 percentage points lower than the industrial PCR, indicating that market fundamentals supported a slightly higher industrial cap rate than was observed in the fourth quarter.
- The industrial PCR moved above the actual industrial cap rate in the fourth quarter, from 0.1 percentage points below the actual to 0.2 percentage points above. This indicates that market fundamentals have softened in the fourth quarter compared to the third quarter. Both the actual industrial cap rate and industrial PCR are increasing.
Fourth Quarter 2023 Multifamily Potential Cap Rate Model
First American’s Multifamily PCR Model estimates a potential national cap rate for all asset classes based on several multifamily property market fundamentals, including transaction volume, renter household formation, and multifamily mortgage flows.
- The multifamily PCR was 5.1 percent, an increase of 0.1 percentage points as compared with the third quarter of 2023.
- The multifamily PCR increased by 0.6 percentage points as compared with one year ago.
Multifamily Cap Rate Outlook Gap
- The actual multifamily cap rate was 0.4 percentage points higher than the multifamily PCR, which suggests that market fundamentals in the fourth quarter supported lower multifamily cap rates than were observed.
- The gap between the actual multifamily cap rate and the multifamily PCR remained the same in the fourth quarter of 2023 as compared to the third quarter.
Fourth Quarter 2023 All-Asset Potential Cap Rate Model
First American’s All-Asset PCR Model estimates a potential national cap rate for all asset classes based on several CRE market fundamentals, including rental income, prevailing occupancy rates, interest rates, the amount of commercial mortgage debt in the economy, and recent property price trends.
- The all-asset PCR was 5.9 percent, declining by 0.1 percentage points compared to the third quarter of 2023.
- The all-asset PCR increased by 0.8 percentage points as compared with one year ago.
All-Asset Cap Rate Outlook Gap
- The actual all-asset cap rate was 0.2 percentage points higher than the PCR, which suggests that market fundamentals in the fourth quarter supported slightly lower actual cap rates than were observed.
- The actual all-asset cap rate moved above the all-asset PCR in the fourth quarter. The all-asset PCR was 0.3 percentage points above the actual cap rate in the third quarter and was 0.2 percentage points below the actual cap rate in the fourth quarter of 2023.
About the Industrial Potential Cap Rate Model
The industrial Potential Cap Rate (PCR) Model estimates cap rates[1] based on the historical relationship between industrial vacancy rates, e-commerce sales as a percent of total retail sales, industrial construction starts, and CRE debt flows. The industrial PCR Model uses these metrics to establish a potential cap rate level that is supported by these market fundamentals. When actual industrial cap rates are significantly above the industrial PCR, it indicates that market fundamentals supported lower cap rates than were observed. Conversely, when actual cap rates are significantly below the potential cap rate level, market fundamentals supported higher cap rates than were observed. Industrial cap rates are aggregated nationally, and the industrial PCR Model is updated quarterly.
A cap rate is a measure of estimated yield, or the return, on an investment property assuming no debt is used to purchase it. Cap rates are calculated by dividing an asset’s net operating income (NOI) by its value. NOI is an asset owner’s remaining income after covering operating expenses, but before servicing debt. Since cap rates do not take debt service into consideration, cap rates are a measure of what is called unlevered yield.
[1] A cap rate is one measure of return on investment provided by a building and is equal to the net operating income (“NOI”) generated by the building divided by the price of the building. For example, an industrial property purchased for $100,000 that generates income of $10,000 a year has a cap rate of 10 percent. Higher cap rates represent higher rates of return, and vice versa.


