The state of today’s industrial commercial real estate (CRE) can largely be explained as the result of pandemic-related aftershocks. During the pandemic, e-commerce sales soared as millions of stuck-at-home consumers turned to online retailers to purchase goods. Meanwhile, COVID-19 disrupted global supply chains, which made it more difficult for retailers to maintain inventory of in-demand items. To cope with these colliding trends, retailers leased more warehouse space to hold excess inventory in the event that they couldn’t acquire product quickly enough from the “just-in-time” supply chain, and leased more logistics space to ensure quick delivery of those products to consumers.
“The industrial market is normalizing, following the overheated pandemic-era market driven by simultaneous demand and supply shocks.”
While industrial CRE had relatively strong fundamentals pre-pandemic, these developments supercharged industrial leasing demand. Demand for space drove industrial vacancy rates to an all-time low of 3.8 percent in the second quarter of 2022, which in turn caused industrial property prices to grow at an annual record pace of 23 percent. Industrial cap rates also reached an all-time low of 5.1 percent in early 2022. However, these trends have since reversed – industrial vacancy rates are climbing, industrial property prices are falling, and cap rates are rising. Is this a sign that industrial CRE is beginning to face headwinds, or is it simply normalizing to pre-pandemic levels?
Introducing the Industrial Potential Cap Rate Model
To answer these questions, we use First American’s Industrial Potential Cap Rate (PCR) model. The industrial PCR model estimates a national potential cap rate based on a number of industrial property market fundamentals, including vacancy rates, construction starts, e-commerce sales relative to total retail sales, and outstanding CRE debt. The model indicates which of these market fundamentals are contributing most significantly to changes in the industrial PCR. For example, the chart below shows how much each market fundamental has contributed to annual changes in the industrial PCR. Bars above zero percent indicate that market fundamentals contributed upward pressure on cap rates, and bars below zero percent indicate downward pressure on cap rates.
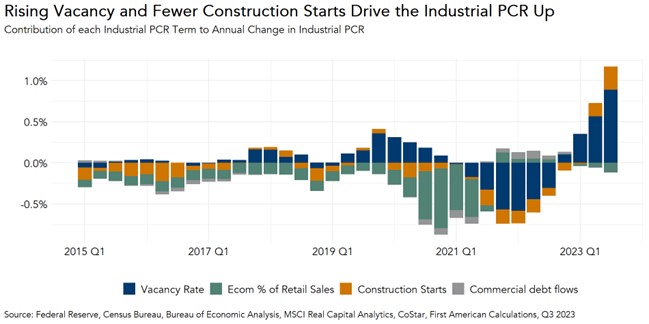
The industrial PCR increased by 1.1 percentage points over the last year, rising from 4.9 percent in the third quarter of 2022 to 6.0 percent in the third quarter of 2023, primarily driven by increasing industrial vacancy rates and fewer industrial construction starts. These two dynamics are related – as demand for industrial space increases, vacancy declines. Demand to lease drives demand to own, and since lower vacancy rates indicate a higher demand to lease, developers build more industrial space to provide for the increased demand to own industrial properties. As a result of these dynamics, industrial construction underway surged to an all-time high of 705 million square feet nationally in the third quarter of 2022, and that newly constructed industrial space is currently being delivered to market. This additional supply is relieving some of the tightness that characterized the industrial leasing market over the last two years, pushing vacancy rates higher.
Since then, however, new industrial construction starts have slowed significantly, from 177 million square feet in the third quarter of 2022 to 41 million square feet in the third quarter of 2023. This indicates that, as leasing demand cooled, so too did demand to own, as reflected by fewer construction starts. Since cap rates are a type of yield on an asset, lower demand to own properties drives cap rates up since, with fewer prospective buyers, investors require a higher rate of return in order to purchase a new property.
The End is Not Nigh
Despite the substantial quantity of industrial square footage coming to market, it is unlikely to cause a glut of space. If all the space currently under construction were to come to market tomorrow vacant, the national vacancy rate for industrial would increase from 5 percent to 7.8 percent, which is roughly in line with historic norms. Further, given the long-term demand drivers for industrial – such as the continually increasing proportion of e-commerce sales relative to total sales as well as the need for even brick-and-mortar retailers to have sophisticated logistics operations – this worst-case situation is highly unlikely.
Taken together, these trends in the industrial property market signal a rebalancing of supply and demand. The industrial market is normalizing, following the overheated pandemic-era market driven by simultaneous demand and supply shocks.
Third Quarter 2023 Industrial Potential Cap Rate Model
- The industrial PCR was 6.0 percent, an increase of 0.3 percentage points as compared with the second quarter of 2023.
- The industrial PCR increased by 1.1 percentage points as compared with one year ago.
Industrial Cap Rate Outlook Gap
- The gap between the actual industrial cap rate and the industrial PCR provides insight into the likelihood of shifts in the actual cap rate. If the industrial PCR is below the actual industrial cap rate, it indicates that fundamentals supported lower cap rates than were observed. If the industrial PCR is above the actual industrial cap rate, it indicates that fundamentals supported higher cap rates than were observed.
- In the third quarter of 2023, the actual national industrial cap rate of 6.1 percent was 0.1 percentage points higher than the potential cap rate, indicating that market fundamentals supported a slightly lower industrial cap rate than was observed in the third quarter.
- The gap between the actual industrial cap rate and the industrial PCR declined by 0.2 percentage points from 0.3 percent in the second quarter. This indicates that market fundamentals more closely supported the observed cap rate in the third quarter than in the second quarter. Both the actual industrial cap rate and industrial PCR are increasing
Third Quarter 2023 Multifamily Potential Cap Rate Model
First American’s Multifamily PCR Model estimates a potential national cap rate for all asset classes based on several multifamily property market fundamentals, including transaction volume, renter household formation, and multifamily mortgage flows.
- The multifamily PCR was 5.0 percent, an increase of 0.1 percentage points as compared with the second quarter of 2023.
- The multifamily PCR increased by 0.6 percentage points as compared with one year ago.
Multifamily Cap Rate Outlook Gap
- The actual multifamily cap rate was 0.2 percentage points higher than the multifamily PCR, which suggests that market fundamentals in the third quarter supported lower multifamily cap rates than were observed.
- The gap between the actual multifamily cap rate and the multifamily PCR contracted by 0.1 percentage points in the third quarter, falling from 0.3 percent in the second quarter of 2023.
Third Quarter 2023 All-Asset Potential Cap Rate Model
First American’s All-Asset PCR Model estimates a potential national cap rate for all asset classes based on several CRE market fundamentals, including rental income, prevailing occupancy rates, interest rates, the amount of commercial mortgage debt in the economy, and recent property price trends.
- The all-asset PCR was 5.9 percent, unchanged from the second quarter of 2023.
- The all-asset PCR increased by 1.2 percentage points as compared with one year ago.
All-Asset Cap Rate Outlook Gap
- The all-asset actual cap rate was 0.1 percentage points higher than the PCR, which suggests that market fundamentals in the third quarter supported slightly lower actual cap rates than were observed.
- The gap between the actual all-asset cap rate and the all-asset PCR contracted in the third quarter, falling from 0.2 percent in the second quarter of 2023.
About the Industrial Potential Cap Rate Model
The industrial Potential Cap Rate (PCR) Model estimates cap rates based on the historical relationship between industrial vacancy rates, e-commerce sales as a percent of total retail sales, industrial construction starts, and CRE debt flows. The industrial PCR Model uses these metrics to establish a potential cap rate level that is supported by these market fundamentals. When actual industrial cap rates are significantly above the industrial PCR, it indicates that market fundamentals supported lower cap rates than were observed. Conversely, when actual cap rates are significantly below the potential cap rate level, market fundamentals supported higher cap rates than were observed. Industrial cap rates are aggregated nationally, and the industrial PCR Model is updated quarterly.
A cap rate is a measure of estimated yield, or the return, on an investment property assuming no debt is used to purchase it. Cap rates are calculated by dividing an asset’s net operating income (NOI) by its value. NOI is an asset owner’s remaining income after covering operating expenses, but before servicing debt. Since cap rates do not take debt service into consideration, cap rates are a measure of what is called unlevered yield.
[1] A cap rate is one measure of return on investment provided by a building and is equal to the net operating income (“NOI”) generated by the building divided by the price of the building. For example, an industrial property purchased for $100,000 that generates income of $10,000 a year has a cap rate of 10 percent. Higher cap rates represent higher rates of return, and vice versa.


