As mortgage rates have steadily risen, affordability has decreased significantly for home buyers across income levels. However, affordability for the potential first-time home buyer – those currently renting – has faced the most pressure. Nationally, affordability for potential first-time home buyers declined 19 percentage points in June 2022 compared with a year earlier as rapid house price appreciation outpaced consumer house-buying power, which was already falling due to rising mortgage rates. However, the affordability outlook remains vastly different based on where a potential first-time home buyer lives. We can measure affordability for all renter households in top U.S. markets based on their household income and the share of homes for sale they can reasonably afford to buy.
“The adage that real estate is local rings true but, even within a single city affordability can look radically different depending on where one sits in the income distribution.”
How Affordability Changes with Income
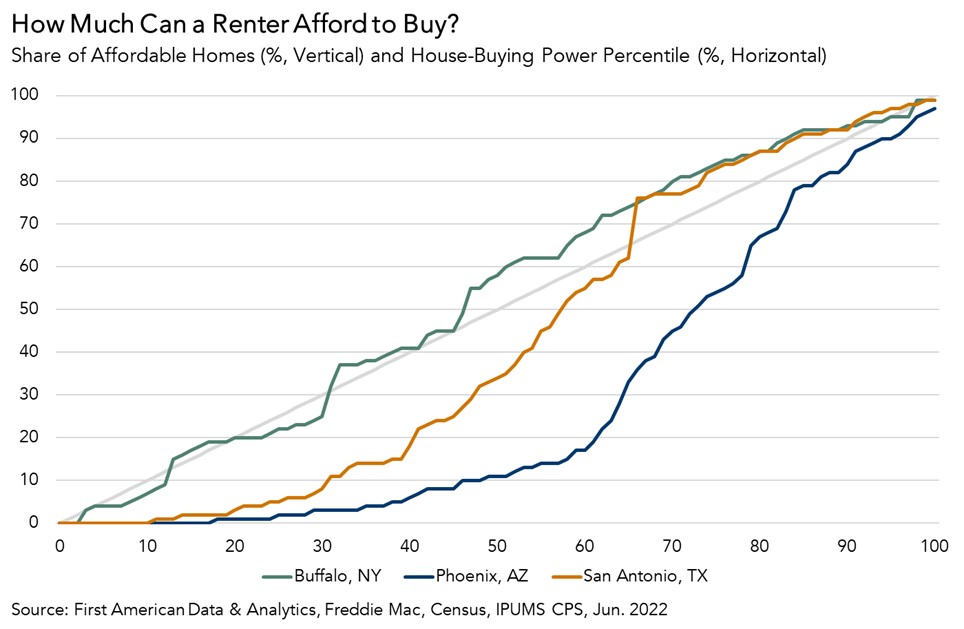
Housing affordability for potential first-time home buyers looks different from market to market because it is dependent on both the supply of housing available at each price point and the renter’s house-buying power. The graph below illustrates the share of homes for sale that are affordable relative to the point at which each household is situated in that market’s renter income distribution. At the 45-degree line running through the middle of the chart, each household in the renter income distribution can afford an equal share of homes for sale in their market. For example, a renter with household income at the 30th percentile of the income distribution can afford 30 percent of the homes for sale in their market. This represents renter affordability equilibrium. Renter households above the renter affordability equilibrium line can afford more than their “share” of homes for sale and those below can afford less.
The shape of the affordability curve can tell us a lot about a market. Cities generally fall into one of three categories: affordable for all potential first-time home buyers, affordable for some, and unaffordable for all. In Buffalo, potential first-time home buyers along nearly the entire income distribution can find more than their “share” of homes to buy that are within their house-buying power. In Phoenix, New York, and Austin, Texas, renter households across the income distribution are unable to afford an equal share of homes to buy. And, in Pittsburgh, San Antonio, and Cincinnati, only some households can find an equal share of homes to buy, usually at the upper range of the income distribution. In San Antonio, renters who make less than $79,000 cannot afford their share of homes for sale, while renters who make more than $79,000 can afford more than their share.
You can find potential first-time affordability graphs by market on First American Economics’ Data Center.
The Most Affordable Markets for Lower Income Households
This analysis can be used to identify the cities where lower income renter households may still find affordable homes to buy. The top 10 cities where renters in the 30th percentile (lower income households) could find the largest supply of homes to purchase in June 2022 were:
- Buffalo, N.Y.: 25 percent
- Pittsburgh: 24 percent
- Oklahoma City: 20 percent
- Cincinnati: 17 percent
- Milwaukee: 17 percent
- Detroit: 15 percent
- Philadelphia: 14 percent
- Birmingham, Ala.: 13 percent
- Cleveland: 13 percent
- Charlotte, N.C.: 12 percent
The impact of the combined affordability headwinds of rising mortgage rates and rapid house price appreciation is evident. None of the markets on the list offer renters in the 30th percentile an equal or greater share of homes to buy. A year ago, in the third quarter of 2021, nine markets met that threshold. However, in the most affordable market, Buffalo, a renter in the 30th percentile, with a household income of $29,800 and a house-buying power of $148,400, could still afford 25 percent of homes for sale.
The adage that real estate is local rings true but, even within a single city, affordability can look radically different depending on where one sits in the income distribution. When considering where the dream of homeownership may be more attainable, potential first-time home buyers should look to the share of affordable homes available to them in each market.
Note: Median renter household income was adjusted in this release to reflect early data from the 2022 Current Population Survey Annual Social and Economic Supplements (CPS ASEC), indicating that household income in 2021 was not statistically different from 2020. Between 2021 and 2022, median household income is assumed to have increased by 4.8 percent.

.jpg)
