In December 2021, the Real House Price Index (RHPI) increased 21.7 percent compared with December 2020, the highest annual growth rate since 2014. The record increase was driven by rising mortgage rates and rapid nominal house price appreciation, which make up two of the three drivers of the RHPI. The 30-year, fixed-rate mortgage and the unadjusted house price index increased by 0.4 percentage points and 21.4 percent respectively. Even though household income increased 5 percent since December 2020 and boosted consumer house-buying power, it was not enough to offset the impact of higher mortgage rates and rising nominal prices on affordability. In the near term, affordability is likely to wane further, as mortgage rates are expected to continue to rise and the pace of house price appreciation exceeds gains in household income. How buyers and sellers react to higher rates may help the housing market regain some balance.
“What goes up, must eventually moderate.”
Existing Homeowners Locked In?
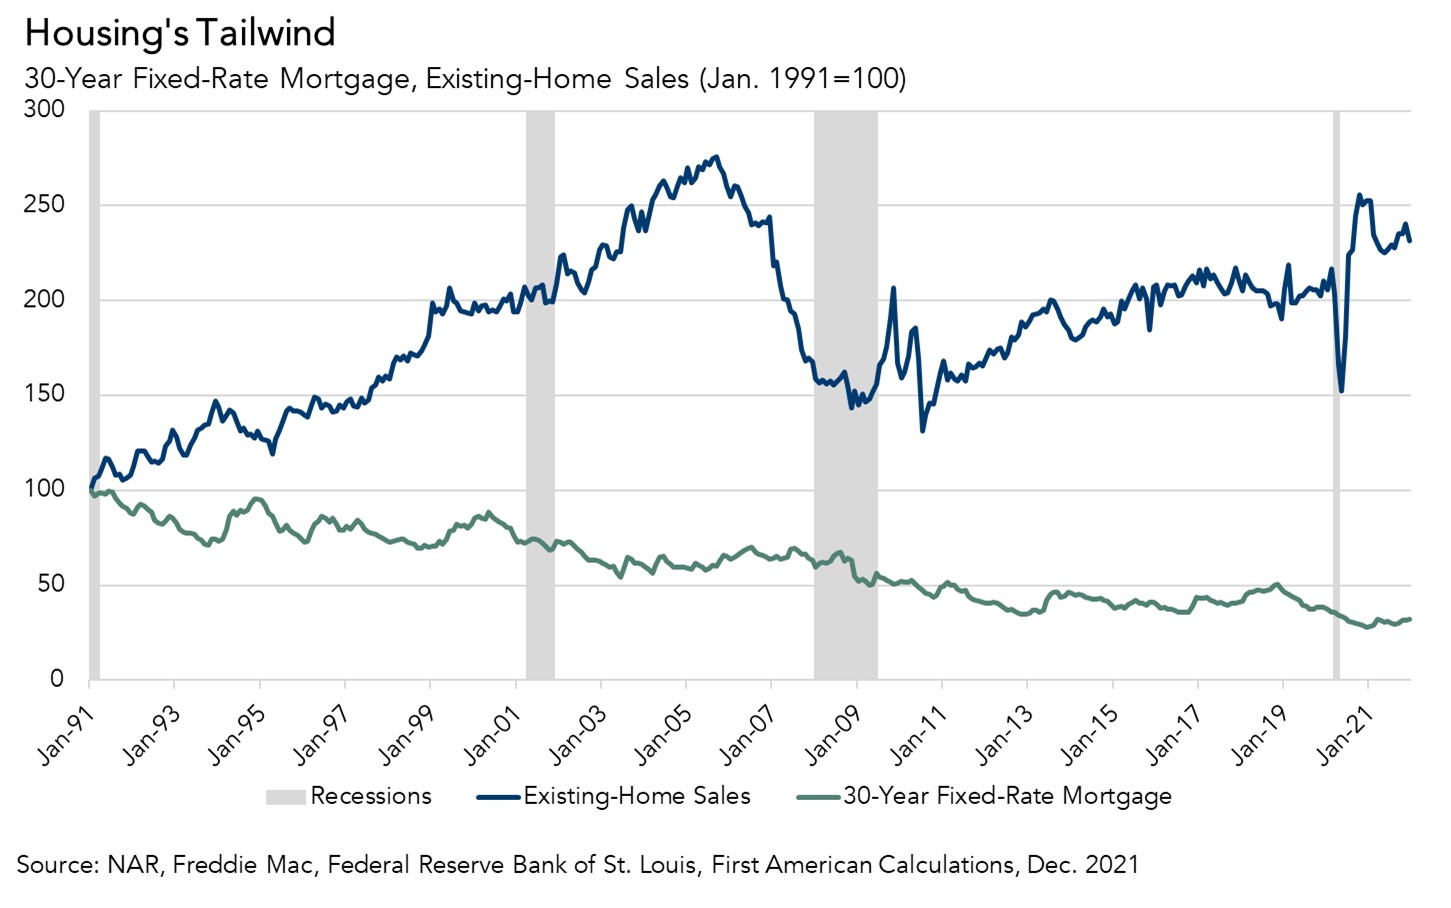
When mortgage rates fall, a potential home buyer can buy the same amount of home for a lower monthly payment or buy more home for the same monthly payment. The 40-year tailwind of declining mortgage rates has allowed homeowners to buy a home at one mortgage rate and then later sell and move into a more expensive home when rates are lower. This long-run decline in mortgage rates has encouraged existing homeowners to move out and move up.
Faster house price appreciation, modestly rising mortgage rates and record low levels of homes for sale have been the economic dynamics dominating the housing market during the second half 2021. While existing homeowners have historically high levels of equity and may feel wealthier because of it, many have also secured historically low fixed-rate mortgages. There is a financial “lock-in” effect that increases as mortgage rates rise and as the size of a mortgage increases. Rising mortgage rates increase the monthly cost of borrowing the same amount that a homeowner owes on their existing mortgage. The higher the prevailing market mortgage rate is relative to the homeowner’s existing mortgage rate, the stronger the lock-in effect. Why move out and move down?
Additionally, the record low level of houses for sale makes it difficult to find a better, more attractive house to buy, so sellers – who are also prospective buyers – don’t sell for fear of not finding something to buy. The good news is that builders have been breaking ground on more new homes, which may alleviate some of the supply crunch and encourage existing buyers to move.
Nonetheless, buying a home is often prompted by lifestyle decisions more so than financial considerations. Despite the financial lock-in, homeowners will still make the decision to move based on lifestyle changes, such as needing more space to accommodate a growing family or relocating for a new job or other reason.
The Housing Market Will Adjust
Homeowners may feel rate-locked into their homes, but first-time home buyers have no such financial lock. Yet, first-time home buyers must also contend with the record low supply of homes in a declining affordability environment. But what goes up, must eventually moderate. Rising rates may be a housing market headwind in 2022, but as some buyers pull back from the market due to affordability and supply constraints and as new construction adds more supply, house prices will moderate, resulting in a more balanced housing market.
For more analysis of affordability, please visit the Real House Price Index. The RHPI is updated monthly with new data. Look for the next edition of the RHPI the week of March 28, 2022.
Sources:
December 2021 Real House Price Index Highlights
The First American Real House Price Index (RHPI) showed that in December 2021:
- Real house prices increased 1.9 percent between November 2021 and December 2021.
- Real house prices increased 21.7 percent between December 2020 and December 2021.
- Consumer house-buying power, how much one can buy based on changes in income and interest rates, increased 0.04 percent between November 2021 and December 2021, and decreased 0.2 percent year over year.
- Median household income has increased 5.2 percent since December 2020 and 69.3 percent since January 2000.
- Real house prices are 4.8 percent less expensive than in January 2000.
- While unadjusted house prices are now 44.5 percent above the housing boom peak in 2006, real, house-buying power-adjusted house prices remain 33.2 percent below their 2006 housing boom peak.
December 2021 Real House Price State Highlights
- The five states with the greatest year-over-year increase in the RHPI are: Arizona (+34.3 percent), Florida (+32.0), South Carolina (+29.4 percent), Connecticut (+28.6 percent), and Georgia (+28.4),
- There were no states with a year-over-year decrease in the RHPI.
December 2021 Real House Price Local Market Highlights
- Among the Core Based Statistical Areas (CBSAs) tracked by First American, the five markets with the greatest year-over-year increase in the RHPI are: Phoenix (+36.3 percent), Charlotte, N.C. (+36.0), Tampa, Fla. (+32.9 percent), Raleigh, N.C. (+31.5 percent), and Atlanta (+31.5 percent).
- Among the Core Based Statistical Areas (CBSAs) tracked by First American, there were no markets with a year-over-year decrease in the RHPI.
About the First American Real House Price Index
The traditional perspective on house prices is fixated on the actual prices and the changes in those prices, which overlooks what matters to potential buyers - their purchasing power, or how much they can afford to buy. First American’s proprietary Real House Price Index (RHPI) adjusts prices for purchasing power by considering how income levels and interest rates influence the amount one can borrow.
The RHPI uses a weighted repeat-sales house price index that measures the price movements of single-family residential properties by time and across geographies, adjusted for the influence of income and interest rate changes on consumer house-buying power. The index is set to equal 100 in January 2000. Changing incomes and interest rates either increase or decrease consumer house-buying power. When incomes rise and mortgage rates fall, consumer house-buying power increases, acting as a deflator of increases in the house price level. For example, if the house price index increases by three percent, but the combination of rising incomes and falling mortgage rates increase consumer buying power over the same period by two percent, then the Real House Price index only increases by 1 percent. The Real House Price Index reflects changes in house prices, but also accounts for changes in consumer house-buying power.
Disclaimer
Opinions, estimates, forecasts and other views contained in this page are those of First American’s Chief Economist, do not necessarily represent the views of First American or its management, should not be construed as indicating First American’s business prospects or expected results, and are subject to change without notice. Although the First American Economics team attempts to provide reliable, useful information, it does not guarantee that the information is accurate, current or suitable for any particular purpose. © 2022 by First American. Information from this page may be used with proper attribution.


