In August 2023, the Real House Price Index (RHPI) jumped up by nearly 25 percent on an annual basis, dragging housing affordability to the lowest point in over three decades. Two factors drove the sharp annual decline in affordability – a 5.4 percent annual increase in nominal house prices, according to our First American Data & Analytics House Price Index, and a 1.9 percentage point increase in the 30-year, fixed mortgage rate compared with one year ago. For home buyers, holding prices constant, the only way to mitigate the loss of affordability caused by higher mortgage rates is with an equivalent, if not greater, increase in household income. Even though household income increased 2.9 percent since August 2022 and boosted consumer house-buying power, it was not enough to offset the affordability loss from higher rates and rising nominal prices.
“In today’s market, our analysis shows that it’s slightly more financially prudent to rent versus own, but the dynamic is trending toward owning once more, thanks to the benefit of equity accumulation.”
House prices reached a new peak in August. For those trying to buy a home, house price appreciation can be intimidating and makes the purchase more expensive, all else held equal. However, once the home is purchased, appreciation helps build equity in the home, and becomes a benefit rather than a cost. As potential first-time home buyers consider homeownership in today’s market, they should carefully weigh the costs of owning a home against the cost of renting.
Gap Between Cost to Own and Cost to Rent Narrows in Third Quarter
The cost of renting is simply the amount of rent paid every month. The monthly cost of owning a home includes taxes, repairs, homeowner’s insurance and the monthly mortgage principal and interest payments. To calculate the monthly cost of homeownership, our analysis assumes the potential buyer is taking out a 30-year, fixed-rate mortgage with a 5 percent down payment on a home at the median sale price. Finally, our monthly cost-to-own analysis factors in the potential benefit of equity accumulation through house price appreciation as well as the potential cost in terms of lost equity from declining house prices.
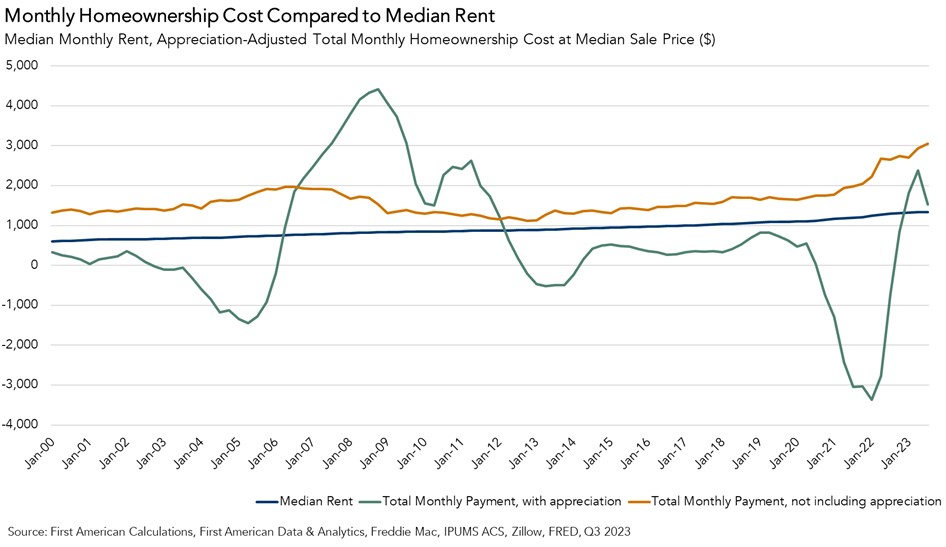
If you simply compare the cost of renting versus the cost of owning without accounting for the benefit or loss from house price changes, it has always been cheaper to rent versus own. In fact, nationally, the gap between the cost of owning versus the cost of renting was the widest in over 20 years of data in the third quarter of 2023, due to higher mortgage rates pushing up the monthly cost of homeownership.
However, once accounting for house price changes, a different story emerges. It was more financially prudent to own versus rent from 2000 until 2005 as house price appreciation was strong. In other words, the equity gained from house price appreciation meant the house was paying homeowners during this time period. Conversely, as house prices declined from 2006 through 2011, the falling house prices added to the cost to the homeowner, and during that time it made more financial sense to rent.
This situation reversed in 2012, and house price appreciation once again began to ‘pay’ the homeowner. It wasn’t until the first quarter of this year that the market shifted back in favor of renting. As mortgage rates remained high while house prices slowed in the first and second quarters of 2023, the median monthly cost to own exceeded the cost to rent. Yet, the gap has since narrowed as house prices re-accelerated in the third quarter of the year. As of the third quarter, the median rent in the U.S. was approximately $1,300, while the median cost of homeownership adjusted for house price appreciation was approximately $1,500.
Will the Rent Versus Own Dynamic Flip Once More?
In today’s market, our analysis shows that it’s slightly more financially prudent to rent versus own, but the dynamic is trending toward owning once more thanks to the benefit of equity accumulation. It’s possible that the dynamic may shift further in favor of renting if mortgage rates move higher and house price appreciation slows. Nonetheless, this analysis demonstrates that the wealth-building effect of home equity is a powerful factor in the homeownership decision. When your home pays you, it makes more sense to buy than to rent.
For more analysis of affordability, please visit the Real House Price Index. The RHPI is updated monthly with new data. Look for the next edition of the RHPI the week of November 27, 2023.
Sources:
August 2023 Real House Price Index Highlights
The First American Data & Analytics’ Real House Price Index (RHPI) showed that in August 2023:
- Real house prices increased 3.0 percent between July 2023 and August 2023.
- Real house prices increased 24.7 percent between August 2022 and August 2023.
- Consumer house-buying power, how much one can buy based on changes in income and mortgage rates, decreased 1.9 percent between July 2023 and August 2023, and decreased 15.5 percent year over year.
- Median household income has increased 2.9 percent since August 2022 and 85.8 percent since January 2000.
- Real house prices are 46.6 percent more expensive than in January 2000.
- Unadjusted house prices are now 55.1 percent above the housing boom peak in 2006, while real, house-buying power-adjusted house prices are 2.6 percent above their 2006 housing boom peak.
August 2023 Real House Price State Highlights
- The five states with the greatest year-over-year increase in the RHPI are: Alaska (+35.7 percent), Maine (+34.2 percent), Connecticut (+33.0 percent), West Virginia (+31.9 percent), and Indiana (+30.4 percent),
- There were no states with a year-over-year decrease in the RHPI.
August 2023 Real House Price Local Market Highlights
- Among the Core Based Statistical Areas (CBSAs) tracked by First American Data & Analytics, the five markets with the greatest year-over-year increase in the RHPI are: San Diego (+32.7 percent), Cincinnati (+32.7 percent), Hartford, Conn. (+32.1 percent), Boston (+31.2 percent), and Indianapolis (+30.2 percent).
- Among the Core Based Statistical Areas (CBSAs) tracked by First American Data & Analytics, there were no markets with a year-over-year decrease in the RHPI.
About the First American Data & Analytics’ Real House Price Index
The traditional perspective on house prices is fixated on the actual prices and the changes in those prices, which overlooks what matters to potential buyers - their purchasing power, or how much they can afford to buy. First American Data & Analytics’ proprietary Real House Price Index (RHPI) adjusts prices for purchasing power by considering how income levels and interest rates influence the amount one can borrow.
The RHPI uses a weighted repeat-sales house price index that measures the price movements of single-family residential properties by time and across geographies, adjusted for the influence of income and interest rate changes on consumer house-buying power. The index is set to equal 100 in January 2000. Changing incomes and interest rates either increase or decrease consumer house-buying power. When incomes rise and mortgage rates fall, consumer house-buying power increases, acting as a deflator of increases in the house price level. For example, if the house price index increases by three percent, but the combination of rising incomes and falling mortgage rates increase consumer buying power over the same period by two percent, then the Real House Price index only increases by 1 percent. The Real House Price Index reflects changes in house prices, but also accounts for changes in consumer house-buying power.
Disclaimer
Opinions, estimates, forecasts and other views contained in this page are those of First American’s Chief Economist, do not necessarily represent the views of First American or its management, should not be construed as indicating First American’s business prospects or expected results, and are subject to change without notice. Although the First American Economics team attempts to provide reliable, useful information, it does not guarantee that the information is accurate, current or suitable for any particular purpose. © 2023 by First American. Information from this page may be used with proper attribution.


