Since the start of the global pandemic in March 2020, we have weathered unprecedented pandemic-induced changes and the housing market has been no exception. The typically hot spring home-buying season in 2020 was initially frozen by the pandemic’s impacts and shelter-in-place orders. As potential home buyers emerged from the stay-at-home orders, the housing market began to heat up. This rising tide of pent-up demand aligned with historically low mortgage rates and hesitant sellers constraining the supply of homes for sale, creating a perfect storm for rapid house price growth.
“While comparisons to 2021 may not flatter the housing market strength entering the 2022 spring home-buying season, historical context matters. The recent pandemic years are anomalous, so comparing today’s housing market with the pre-pandemic era provides helpful insight.”
The ability to work-from-home further increased demand, as potential home buyers realized they had more geographic flexibility in their home searches. The result? The most competitive housing market in recent history. While housing market potential entering the 2022 spring home-buying season may be easing down from recent peaks, potential home sales remain strong and above pre-pandemic levels.
In March, the market potential for existing-home sales based on fundamentals was estimated to be 5.97 million at a seasonally adjusted annualized rate (SAAR), down 3.2 percent compared with February, and 3.9 percent lower than one year ago. Yet, the market potential for home sales remains 8.6 percent above March 2019, the start of the last full spring home-buying season before the pandemic hit.
Dare to Compare?
Perhaps a more insightful point of comparison is not last year’s spring home-buying season, and certainly not 2020, but rather the 2019 housing market. In 2019, the economy was growing, demographic demand was strong, rates were sitting at approximately 4 percent, and housing supply was constrained. Examining what’s changed since the pre-pandemic spring housing market offers helpful perspective on the 2022 spring home-buying season.
Homeowners Are Staying Put Longer, Constricting Housing Supply
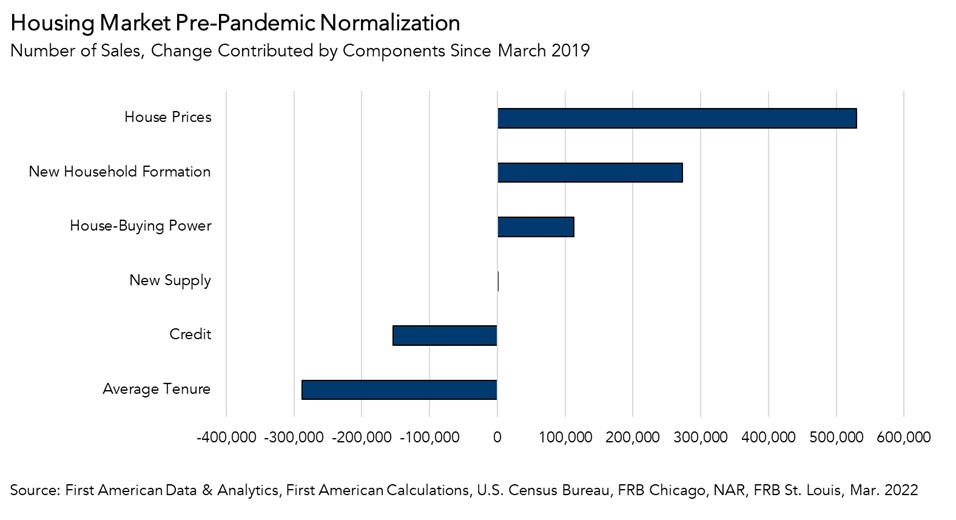
The majority of our for-sale housing supply comes from existing homes, and existing homeowners are staying put. The average length of time someone lives in their home continues to set new records, rising to approximately 10.5 years in March, up from 9.75 years in the spring of 2019. The longer people live in their homes, the fewer and fewer homes are listed for sale, compounding the housing supply shortage – you can’t buy what’s not for sale, and you won’t sell if you can’t find something better to buy. Homeowners staying put reduced housing market potential by 288,000 potential home sales compared with March 2019.
Demand for Housing is Even Stronger
While the lack of housing supply holds back sales activity, three forces have continued to propel the housing market forward.
- Household formation, a primary and long-term driver of home-buying demand, has continued to rise and contributed to a gain of nearly 273,000 potential home sales since March 2019.
- Strong house price appreciation typically encourages more existing homeowners to move. As homeowners gain equity in their homes, they may be more likely to consider using the equity to purchase a larger or more attractive home. Rapid house price appreciation has increased housing market potential by approximately 530,000 potential home sales in March compared with 2019.
- House-buying power, how much home one can afford to buy given household income and the prevailing mortgage rate, is 5.6 percent higher than in March 2019, thanks to modestly lower mortgage rates now compared with 2019 and higher household incomes. The increase in house-buying power boosted housing market potential by approximately 113,000 potential home sales in March compared with 2019.
Another Strong Year Ahead?
As mortgage rates continue to rise and dampen affordability and the historically low level of homes for sale limits purchase activity, it’s normal to see moderation in the market potential for existing-home sales. Yet, let’s keep the moderation in perspective. Housing market potential today remains above 2019 levels, which was the housing market’s strongest year in over a decade at the time thanks to the strengthening demographic tailwind and strong house-buying power. While comparisons to 2021 may not flatter the housing market entering the 2022 spring home-buying season, historical context matters. The recent pandemic years are anomalous, so comparing today’s housing market with the pre-pandemic era provides helpful insight.
March 2022 Potential Home Sales
For the month of March, First American updated its proprietary Potential Home Sales Model to show that:
- Potential existing-home sales decreased to a 5.97 million seasonally adjusted annualized rate (SAAR), a 3.2 percent month-over-month decrease.
- This represents a 71.1 percent increase from the market potential low point reached in February 1993.
- The market potential for existing-home sales decreased 3.9 percent compared with a year ago, a loss of 240,100 (SAAR) sales.
- Currently, potential existing-home sales is 823,800 (SAAR), or 12.1 percent below the pre-recession peak of market potential, which occurred in April 2006.
First American Deputy Chief Economist Odeta Kushi contributed to this post.
What Insight Does the Potential Home Sales Model Reveal?
When considering the right time to buy or sell a home, an important factor in the decision should be the market’s overall health, which is largely a function of supply and demand. Knowing how close the market is to a healthy level of activity can help consumers determine if it is a good time to buy or sell, and what might happen to the market in the future. That is difficult to assess when looking at the number of homes sold at a particular point in time without understanding the health of the market at that time. Historical context is critically important. Our potential home sales model measures what we believe a healthy market level of home sales should be based on the economic, demographic and housing market environments.
About the Potential Home Sales Model
Potential home sales measures existing-home sales, which include single-family homes, townhomes, condominiums and co-ops on a seasonally adjusted annualized rate based on the historical relationship between existing-home sales and U.S. population demographic data, homeowner tenure, house-buying power in the U.S. economy, price trends in the U.S. housing market, and conditions in the financial market. When the actual level of existing-home sales are significantly above potential home sales, the pace of turnover is not supported by market fundamentals and there is an increased likelihood of a market correction. Conversely, seasonally adjusted, annualized rates of actual existing-home sales below the level of potential existing-home sales indicate market turnover is underperforming the rate fundamentally supported by the current conditions. Actual seasonally adjusted annualized existing-home sales may exceed or fall short of the potential rate of sales for a variety of reasons, including non-traditional market conditions, policy constraints and market participant behavior. Recent potential home sale estimates are subject to revision to reflect the most up-to-date information available on the economy, housing market and financial conditions. The Potential Home Sales model is published prior to the National Association of Realtors’ Existing-Home Sales report each month.


