Housing market potential regained strength in the month of April, according to our Potential Home Sales Model. In April, housing market potential increased 1.3 percent compared with March, and is now nearly 30 percent higher than the pandemic-driven collapse last April. Relative to two years ago, housing market potential is 16.7 percent higher and will likely remain elevated as rates continue to hover near historic lows, the economy improves and puts upward pressure on wages, and millennials continue to choose home owning over renting.
“You can’t buy what’s not for sale, even if you can afford it.”
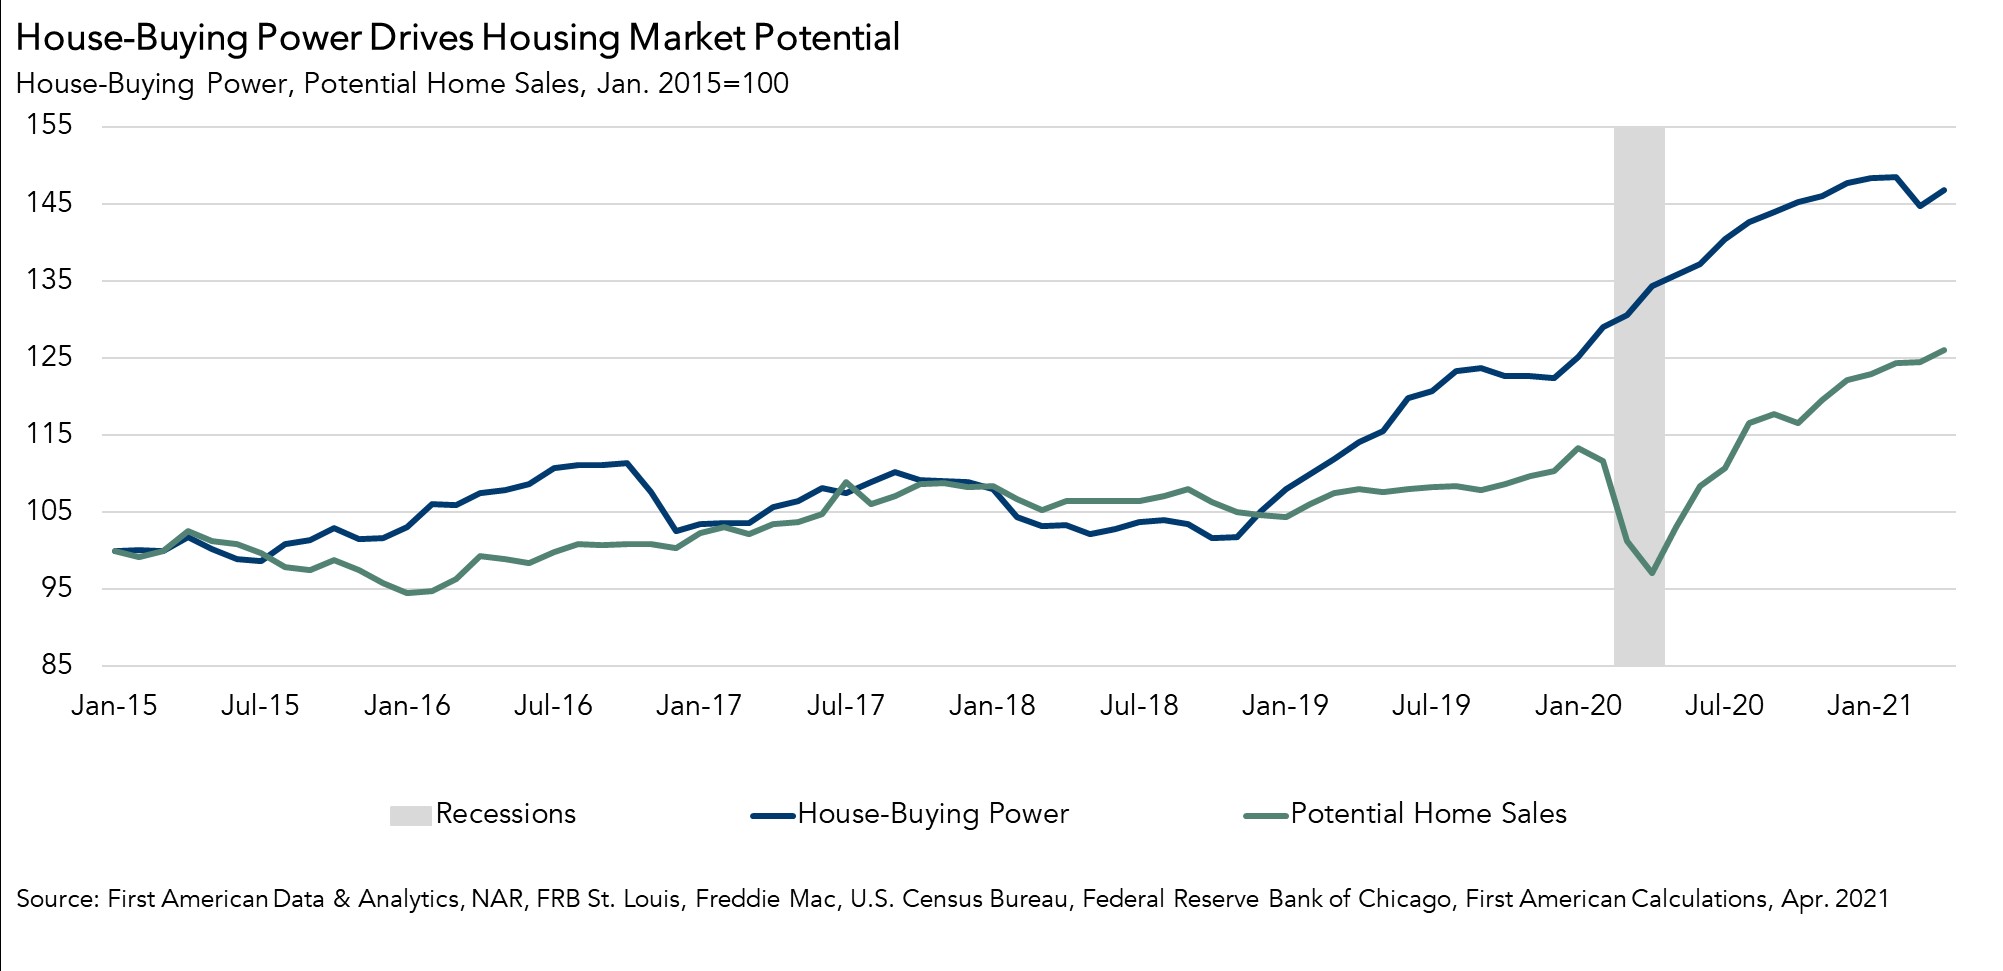
House-Buying Power Drives Housing Market Potential
One of the primary drivers of housing market potential in April was the rise in house-buying power, which increased by $6,900 compared with the previous month, contributing to a gain of nearly 49,000 potential home sales. House-buying power is a function of changes in mortgage rates and household income, which both contributed positively this month. After increasing by 0.27 percentage points in March, mortgage rates settled back down in April, falling by 0.02 percentage points. While it may not seem like much, holding income constant at its March level, a 0.02 percentage point decline in mortgage rates increases house-buying more by $1,300.
However, rising household income fueled the bulk of the increase in house-buying power this month. We estimate household income as a function of average hourly earnings and the average number of weekly hours worked. In April, average hourly earnings increased by 0.7 percent, considerably higher than the 2009-2020 average monthly growth rate of 0.2 percent. The number of average weekly hours worked also increased modestly in the month of April. As more and more people are vaccinated and the economy strengthens further, demand for labor increases, and that puts upward pressure on wages as employers compete to attract employees, as was the case in April.
But You Can’t Buy What’s Not for Sale
Rising income, rates near historical lows, and higher than average savings rates bode well for home buying. Yet, you can’t buy what’s not for sale. The record low level of houses for sale makes it difficult to find the next house to buy, so sellers – who are often also prospective buyers – don’t sell for fear of not finding their next home to buy. If sellers all choose to sell, they would benefit as buyers because the inventory of homes for sale would increase and alleviate the supply shortage. However, the risk of selling in a market with a shortage of inventory prevents many existing homeowners from putting their homes on the market. The result is increasingly higher average tenure length, which reached a historical high of 10.56 years in April. Existing homeowners staying put accounted for more than 15,000 fewer potential home sales in April. The problem in the market today is supply. You can’t buy what’s not for sale, even if you can afford it.
Will Summer Bring Supply Relief?
A growing economy in the summer months has multiple implications for the housing market. Growing consumer confidence, a stronger labor market, and higher wages bode well for housing demand. While a growing economy and improving public health conditions may also spur hesitant existing owners to list their homes for sale, it’s unlikely to significantly ease the super sellers’ market conditions.
April 2021 Potential Home Sales
For the month of April, First American updated its proprietary Potential Home Sales Model to show that:
- Potential existing-home sales increased to a 6.31 million seasonally adjusted annualized rate (SAAR), a 1.3 percent month-over-month increase.
- This represents an 81 percent increase from the market potential low point reached in February 1993.
- The market potential for existing-home sales increased 30 percent compared with a year ago, a gain of 1,450,345 (SAAR) sales. The year-over-year comparison is very large this month as the housing market came to a halt last year at this time when the pandemic shut down the economy. Housing rebounded sharply in the summer.
- Currently, potential existing-home sales is 481,854 (SAAR), or 7.1 percent below the pre-recession peak of market potential, which occurred in April 2006.
Market Performance Gap
- The market for existing-home sales outperformed its potential by 4.4 percent or an estimated 277,400 (SAAR) sales.
- The market performance gap decreased by an estimated 16,800 (SAAR) sales between March 2021 and April 2021.
First American Deputy Chief Economist Odeta Kushi contributed to this post.
What Insight Does the Potential Home Sales Model Reveal?
When considering the right time to buy or sell a home, an important factor in the decision should be the market’s overall health, which is largely a function of supply and demand. Knowing how close the market is to a healthy level of activity can help consumers determine if it is a good time to buy or sell, and what might happen to the market in the future. That is difficult to assess when looking at the number of homes sold at a particular point in time without understanding the health of the market at that time. Historical context is critically important. Our potential home sales model measures what we believe a healthy market level of home sales should be based on the economic, demographic and housing market environments.
About the Potential Home Sales Model
Potential home sales measures existing-home sales, which include single-family homes, townhomes, condominiums and co-ops on a seasonally adjusted annualized rate based on the historical relationship between existing-home sales and U.S. population demographic data, homeowner tenure, house-buying power in the U.S. economy, price trends in the U.S. housing market, and conditions in the financial market. When the actual level of existing-home sales are significantly above potential home sales, the pace of turnover is not supported by market fundamentals and there is an increased likelihood of a market correction. Conversely, seasonally adjusted, annualized rates of actual existing-home sales below the level of potential existing-home sales indicate market turnover is underperforming the rate fundamentally supported by the current conditions. Actual seasonally adjusted annualized existing-home sales may exceed or fall short of the potential rate of sales for a variety of reasons, including non-traditional market conditions, policy constraints and market participant behavior. Recent potential home sale estimates are subject to revision to reflect the most up-to-date information available on the economy, housing market and financial conditions. The Potential Home Sales model is published prior to the National Association of Realtors’ Existing-Home Sales report each month.

.jpg)
