In September 2021, existing-home sales increased to a 6.29 million seasonally adjusted annualized rate (SAAR). Prior to the pandemic, the housing market had not reached this sales pace since 2006. We may see another strong month in October, as housing market potential increased 10.3 percent compared with one year ago to 6.27 million (SAAR), according to our measure of the market potential for existing-home sales.
“Strong demographic demand will continue to act as the wind in the housing market’s sails.”
As we approach the final weeks of the year, it’s important to reflect on how the housing market has performed. Analyzing the individual economic forces that have driven the continued growth of market potential for existing-home sales can provide insight into how the housing market may fare in 2022.
Understanding the Strength in Housing Market Potential
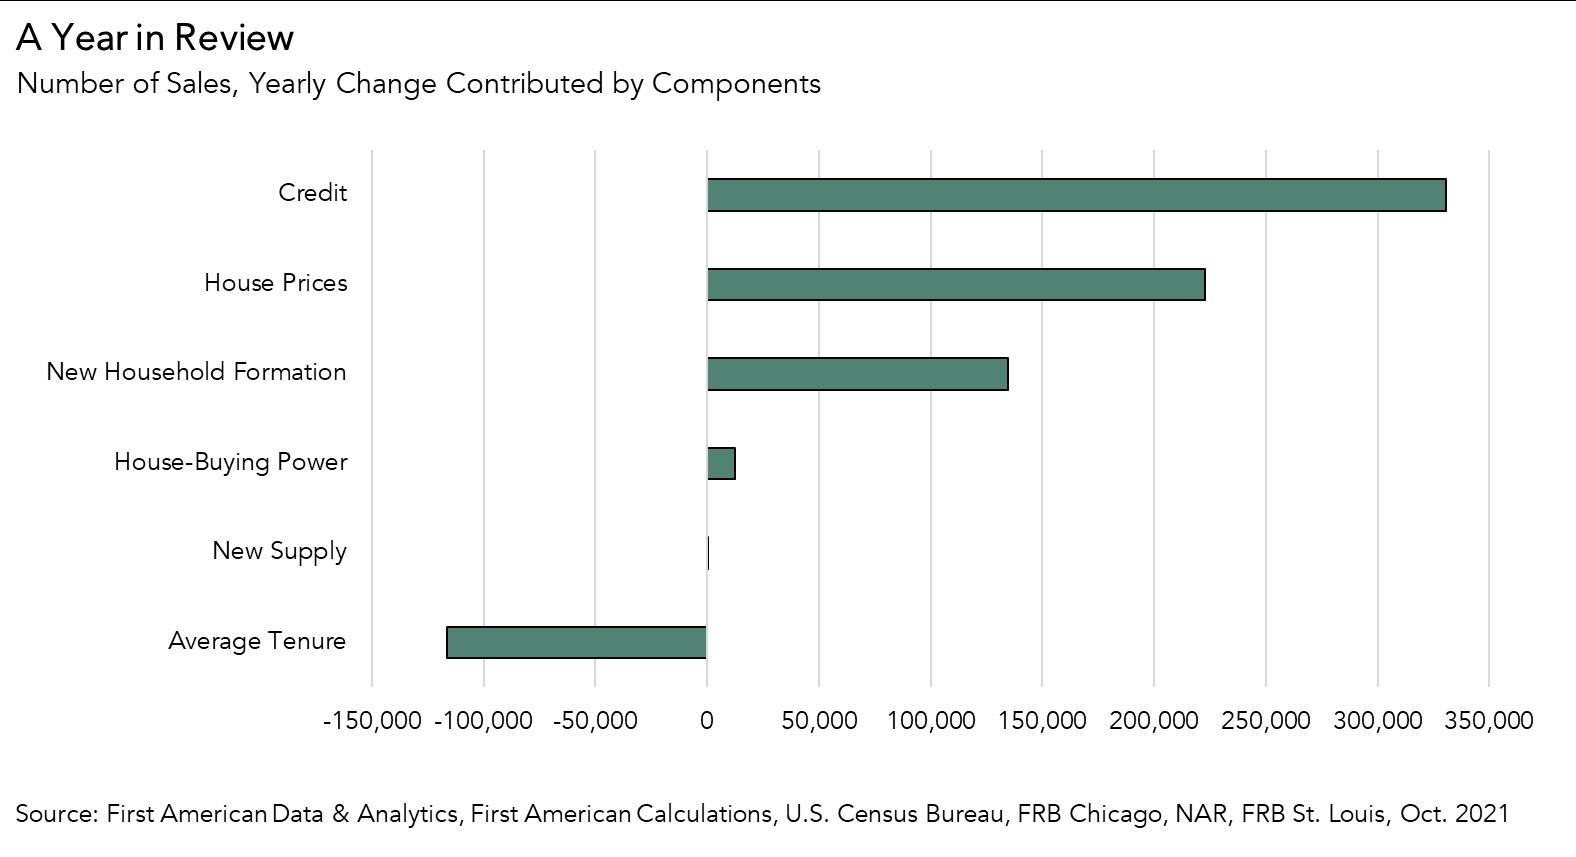
- Credit Standards Loosened: When lending standards are tight, fewer people can qualify for a mortgage to buy a home, thus they are more likely to stay in their current home, limiting the supply of homes for sale. When the pandemic hit, lenders tightened their lending criteria to account for the greater likelihood of forbearance and delinquency. Since the peak of the pandemic in the spring of 2020, lending standards have bounced around but, ultimately, trended toward looser conditions. In October, credit loosened compared with one year ago as the economy continued to improve and lender confidence increased. Loosening credit conditions increased housing market potential by approximately 331,000 potential home sales compared with one year ago.
- Historic House Price Appreciation: As homeowners gain equity in their homes, they may be more likely to consider using the equity to purchase a larger or more attractive home. The historic imbalance in housing supply relative to demand over the last year fueled faster house price appreciation, which increased housing market potential by nearly 223,000 potential home sales in October compared with one year ago.
- Household Formation Growth Continued: Household formation continued to grow over the last year, largely driven by millennials, accelerating demand for housing. The increase in household formation enhanced market potential by nearly 134,000 potential home sales in October compared with a year ago.
- House-Buying Power Increased Modestly: House-buying power, how much home one can afford to buy given household income and the prevailing mortgage rate, increased 0.6 percent compared with one year ago. The modest increase in house-buying power was due to the 3.6 percent year-over-year increase in household income. Rates pushed back against the increase, as the average 30-year, fixed mortgage rate in October 2021 was 0.23 percentage points higher than one year ago. The increase in house-buying power boosted market potential by 12,000 potential home sales.
The Only Economic Force that Reduced Housing Market Potential
- Lack of Existing-Home Supply: The average length of time someone lives in their home continues to set new records, rising to approximately 10.7 years in October, up from 10.4 years one year ago. The longer people live in their homes means fewer and fewer people list their homes for sale, compounding the housing supply shortage – you can’t buy what’s not for sale, and you won’t sell if you can’t find something better to buy. The increase in the average length of time someone lives in their home had the only negative impact on housing market potential compared with on year ago, reducing it by 116,000 potential home sales. The lack of supply is the primary constraint to the housing market.
What Does This Mean for Market Potential in 2022?
In 2022, the average length of time someone lives in their home appears poised to rise again, especially as mortgage rates increase, which will prolong the housing supply shortage and dampen housing market potential. The labor market recovery is expected to continue, putting upward pressure on wages, helping consumer house-buying power. Yet, the improving economy is also likely to put upward pressure on mortgage rates. The winner of the tug-of-war between rising rates and higher household income will determine the direction of house-buying power. But, even if rising rates outpace the impact of higher incomes, buying a home is more than a financial calculation. Millennials are widely expected to continue to form households, boosting demand for homes. Strong demographic demand will continue to act as the wind in the housing market’s sails.
October 2021 Potential Home Sales
For the month of October, First American updated its proprietary Potential Home Sales Model to show that:
- Potential existing-home sales increased to a 6.27 million seasonally adjusted annualized rate (SAAR), a 0.1 percent month-over-month increase.
- This represents a 79.8 percent increase from the market potential low point reached in February 1993.
- The market potential for existing-home sales increased 10.3 percent compared with a year ago, a gain of nearly 584,000 (SAAR) sales.
- Currently, potential existing-home sales is 522,000 (SAAR), or 7.7 percent below the pre-recession peak of market potential, which occurred in April 2006.
Market Performance Gap
- The market for existing-home sales outperformed its potential by 8.4 percent or an estimated 525,000 (SAAR) sales.
- The market performance gap increased by an estimated 52,000 (SAAR) sales between September 2021 and October 2021.
First American Deputy Chief Economist Odeta Kushi contributed to this post.
What Insight Does the Potential Home Sales Model Reveal?
When considering the right time to buy or sell a home, an important factor in the decision should be the market’s overall health, which is largely a function of supply and demand. Knowing how close the market is to a healthy level of activity can help consumers determine if it is a good time to buy or sell, and what might happen to the market in the future. That is difficult to assess when looking at the number of homes sold at a particular point in time without understanding the health of the market at that time. Historical context is critically important. Our potential home sales model measures what we believe a healthy market level of home sales should be based on the economic, demographic and housing market environments.
About the Potential Home Sales Model
Potential home sales measures existing-home sales, which include single-family homes, townhomes, condominiums and co-ops on a seasonally adjusted annualized rate based on the historical relationship between existing-home sales and U.S. population demographic data, homeowner tenure, house-buying power in the U.S. economy, price trends in the U.S. housing market, and conditions in the financial market. When the actual level of existing-home sales are significantly above potential home sales, the pace of turnover is not supported by market fundamentals and there is an increased likelihood of a market correction. Conversely, seasonally adjusted, annualized rates of actual existing-home sales below the level of potential existing-home sales indicate market turnover is underperforming the rate fundamentally supported by the current conditions. Actual seasonally adjusted annualized existing-home sales may exceed or fall short of the potential rate of sales for a variety of reasons, including non-traditional market conditions, policy constraints and market participant behavior. Recent potential home sale estimates are subject to revision to reflect the most up-to-date information available on the economy, housing market and financial conditions. The Potential Home Sales model is published prior to the National Association of Realtors’ Existing-Home Sales report each month.


