In 2019, the growth in consumer house-buying power outpaced house price appreciation for the median renter trying to buy the median priced home. But, there are many renters with household incomes below the median income in their cities. We can measure affordability for all renter households based on their household income and the share of homes for sale they can reasonably afford to buy. Depending on the city, renters with lower household income levels still may be able to pursue the dream of homeownership.
“When considering affordability, not all cities are created equal, but there are cities where the dream of homeownership for low income renters may be more attainable then many realize.”
Affordability Equilibrium Varies Greatly by City
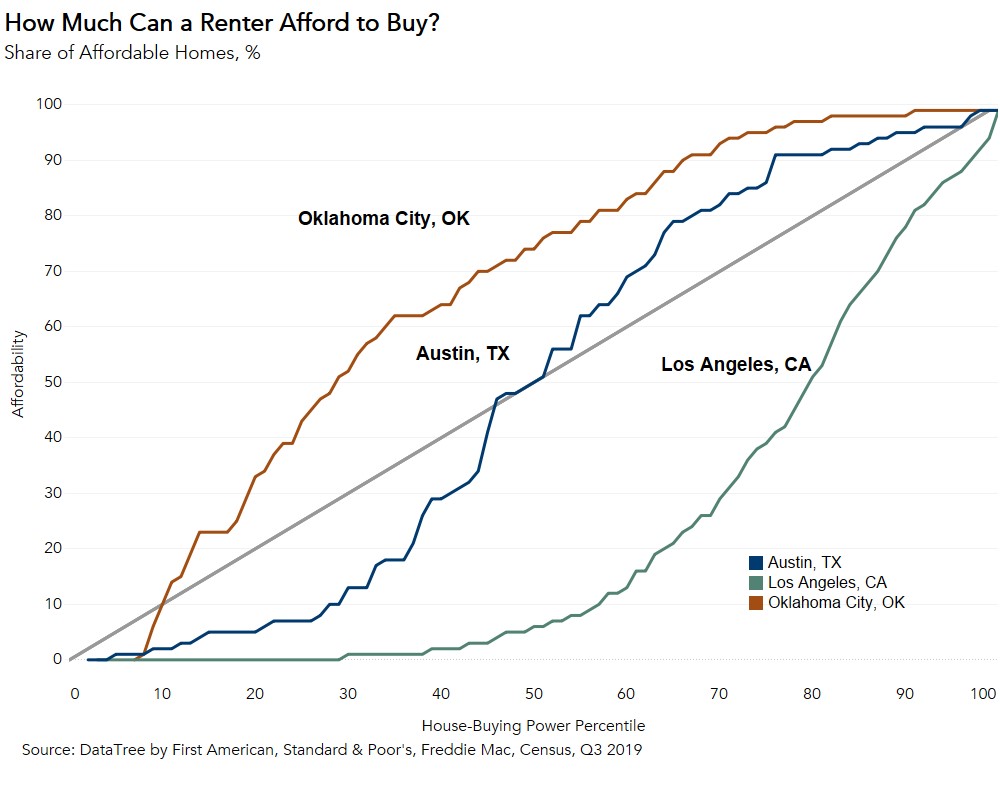
Where a renter sits in the house-buying power distribution greatly influences the supply of affordable homes they can afford. In fact, we can identify the point at which each household in the rental income distribution can afford an equal share of homes for sale in their market – the point of renter affordability equilibrium for that city.
For example, Oklahoma City is the most affordable for median renters, Los Angeles is the least, and Austin is in the middle. The 45-degree line running through the middle of the chart represents renter affordability equilibrium. If you’re along this line, that means that each household in the rental income distribution from lowest to highest can afford an equal share of homes for sale in their market.
In Los Angeles, a renter in the 30th percentile of household income had a house-buying power of $184,300 and could afford less than one percent of all the homes for sale in the third quarter of 2019. On the contrary, in Oklahoma City, a renter in the 30th percentile could afford 52 percent of the homes for sale, with a renter house-buying power of $165,000.
Finally, in Austin, the city dubbed the “hottest real estate market in the country,” a renter in the 30th percentile of household income could afford 13 percent of the homes available for sale, with a house-buying power of $201,000. Renter households above the renter affordability equilibrium line can afford more than their “share” of homes for sale and those below can afford less than their “share.”
The Most Affordable Markets for Lower Income Households
We can use this analysis to identify the cities where renters with lower household income levels still may be able to pursue the dream of homeownership. We ranked cities where renters in the 30th percentile (lower income households) could find the largest supply of homes they could afford to purchase in the third quarter of 2019:
- Louisville, Ky.: 55 percent
- Memphis, Tenn. : 52 percent
- Oklahoma City: 52 percent
- Indianapolis: 36 percent
- Milwaukee: 34 percent
- Pittsburgh: 34 percent
- Dallas: 33 percent
- Atlanta: 31 percent
- Jacksonville, Fla.: 31 percent
- Kansas City, Mo.: 31 percent
In the most affordable market, Louisville, a renter in the 30th percentile, with a household income of $31,600 and a house-buying power of $196,700, could afford 55 percent of homes for sale. In fact, nearly all households are at or above the renter affordability equilibrium line in Louisville. In contrast, Los Angeles is a market where almost no one can afford a home at or above the renter affordability equilibrium line. A renter household in the 80th percentile (high-income household) with a house-buying power of $654,200, could only afford 51 percent of homes for sale in Los Angeles in the third quarter of 2019.
When considering affordability, not all cities are created equal, but there are cities where the dream of homeownership for low income renters may be more attainable then many realize. Looking at the complete house-buying power distribution of renter households reveals that cities like Louisville, Memphis and Oklahoma City – provide even lower income renters with a large supply of homes they can afford to purchase.
Data Sources:
About the First-Time Home Buyer Outlook Report
Housing affordability is often measured as the median household income relative to the income needed to purchase the median-priced home. And it is often the case that the relative rates of change in house prices and income is synonymous with a change in affordability. This overlooks what matters to potential buyers – their house-buying power, or how much they can afford to buy. First American’s proprietary First-Time Home Buyer Outlook Report examines first-time home buyer house-buying power by considering how mortgage rates, renter income levels, PMI, and property taxes influence the amount one can afford to buy and the share of homes for sale that are affordable at each point in the house-buying power distribution.
First-time home buyer house-buying power is based on median renter’s income, the prevailing 30-year, fixed mortgage rate, the most recent year’s property tax rate for the geography of the renter, and assumes a fixed cost for private mortgage insurance, a 5 percent down payment and that one-third of their pre-tax income is used for the mortgage. First-time home buyer house-buying power can then be used to identify the share of the homes for sale the first-time home buyer could afford to buy. As a measure of affordability, the higher the share of homes for sale that first-time home buyers can afford to buy, the more affordable the market.


