The coronavirus pandemic continues to wreak havoc on global and domestic economies, yet housing has thus far managed an impressive V-shaped recovery. Housing’s strong rebound has been driven by several factors that existed before the coronavirus outbreak but have continued or even gained strength amid the pandemic. Mortgage rates are even lower (below 3% for the first time ever in July), supply is even tighter (record low inventory levels and going lower), and demographic demand continues as millennials age into their prime home-buying years and try to take advantage of low rates. The growing demand against dwindling supply has worsened the supply and demand imbalance, which will continue to drive nominal house price appreciation.
“Faster nominal house price appreciation and lower household income can erode, or even completely eliminate, the affordability boost from today’s record low mortgage rates.”
Nationally, house-buying power, how much home one can afford to buy given their income and the prevailing 30-year, fixed-rate mortgage, continues to outpace nominal house price appreciation, resulting in a 4.8 percent improvement in affordability relative to one year ago. Yet, all real estate is local and affordability dynamics can vary greatly at the market level.
The Five Cities Where Affordability Decreased the Most
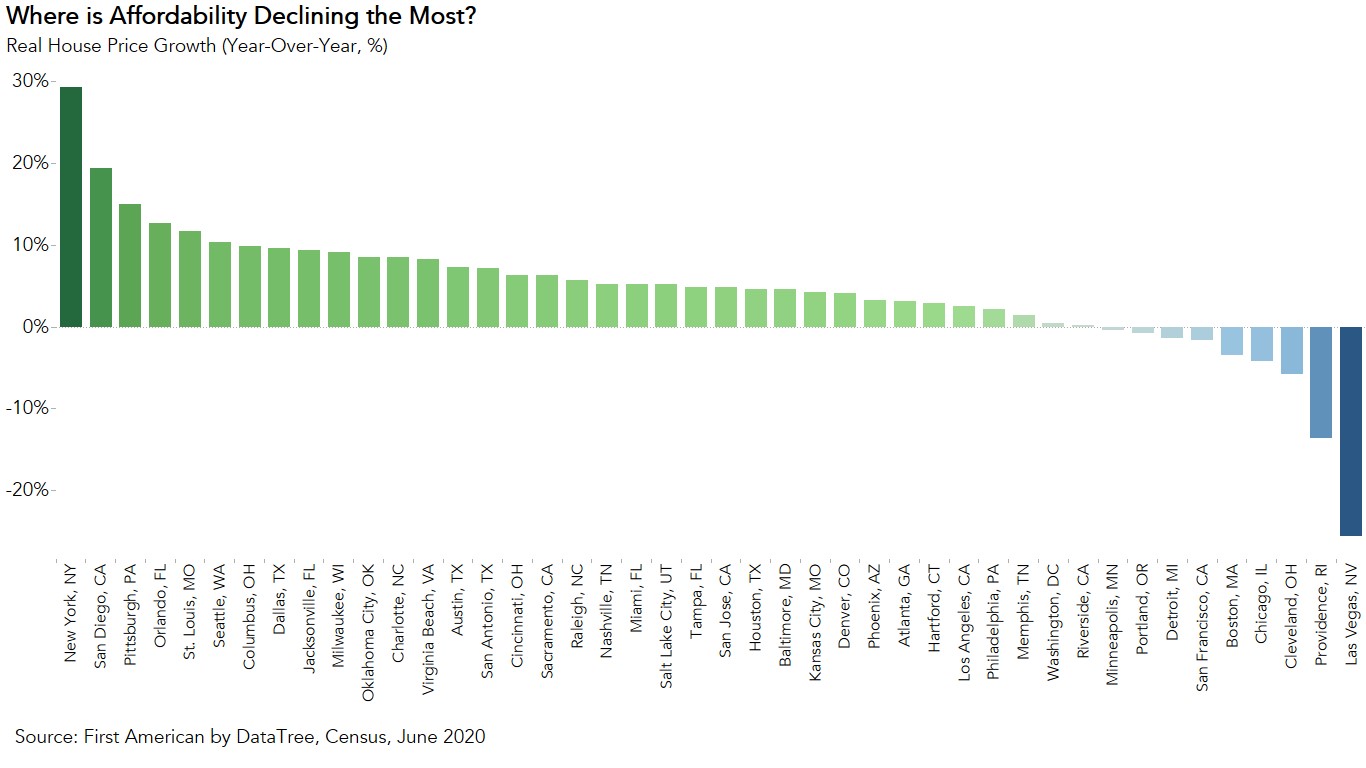
As the old adage goes, real estate is all about “location, location, location.” In June, the Real House Price Index (RHPI) increased in 35 of the 44 markets we track year over year, meaning affordability declined in each. The five markets with the greatest year-over-year increases in the RHPI and thus the greatest declines in affordability were:
|
|
|
||
|
Yearly Changes |
|||
|
City |
House-Buying Power |
Nominal House Price Index |
RHPI |
|
1.) New York, NY |
-16.8% |
7.5% |
29.3% |
|
2.) San Diego |
-11.1% |
6.1% |
19.4% |
|
3.) Pittsburgh |
-4.1% |
10.4% |
15.0% |
|
4.) Orlando |
-3.8% |
8.4% |
12.6% |
|
5.) St. Louis |
-2.0% |
9.5% |
11.8% |
Affordability declined the most year over year in New York City, where real house prices as measured by the RHPI increased by 29.3 percent. Nominal house prices increased by 7.6 percent, and house-buying power declined by 16.8 percent. Even though nominal house price appreciation in New York City was less than in some other cities, the big drop in house-buying power meant New York City saw the greatest annual decrease in affordability. Since the average 30-year, fixed mortgage rate in June is the same across cities, the decline in house-buying power was driven by a significant decrease in median household income. Nominal house price appreciation grew fastest in Pittsburgh and house-buying power fell as well, putting Pittsburgh third on the list for greatest annual decrease in affordability.
Fall May Bring Declining Affordability
But, is three months enough to indicate a trend? While the path of economic recovery remains uncertain, the dynamics in these markets demonstrate how changes in house-buying power influences affordability. While lower mortgage rates have boosted demand in a supply constrained market, putting upward pressure on nominal house price appreciation, the impact of the pandemic on the labor market has significantly impacted household income.
Faster nominal house price appreciation and lower household income can erode, or even completely eliminate, the affordability boost from today’s record low mortgage rates. From June 2019 until April 2020, affordability was improving for all top markets as house-buying power outpaced house price appreciation. However, as the pandemic and its impacts linger, house-buying power is no longer winning the affordability tug-of-war against nominal house price appreciation in many markets.
For more analysis of affordability, please visit the Real House Price Index. The RHPI is updated monthly with new data. Look for the next edition of the RHPI the week of September 28, 2020.
Sources:
June 2020 Real House Price Index Highlights
The First American Real House Price Index (RHPI) showed that in June 2020:
- Real house prices decreased 0.2 percent between May 2020 and June 2020.
- Real house prices declined 4.8 percent between June 2019 and June 2020.
- Consumer house-buying power, how much one can buy based on changes in income and interest rates, increased 1.1 percent between May 2020 and June 2020, and increased 13.7 percent year over year.
- Median household income has increased 0.2 percent since May 2020 and 64 percent since January 2000.
- Real house prices are 22.4 percent less expensive than in January 2000.
- While unadjusted house prices are now 13.5 percent above the housing boom peak in 2006, real, house-buying power-adjusted house prices remain 45 percent below their 2006 housing boom peak.
June 2020 Real House Price State Highlights
- The five states with the greatest year-over-year increase in the RHPI are: Vermont (+10.6 percent), New Mexico (+10.3 percent), Montana (+9.4 percent), Texas (+8.8 percent), and Oklahoma (+8.4 percent).
- The five states with the greatest year-over-year decrease in the RHPI are: Louisiana (-10.1 percent), New Hampshire (-7.4 percent), West Virginia (-7.1 percent), New Jersey (-6.9 percent), and Pennsylvania (-4.6 percent).
June 2020 Real House Price Local Market Highlights
- Among the Core Based Statistical Areas (CBSAs) tracked by First American, the five markets with the greatest year-over-year increase in the RHPI are: New York (+29.3 percent), San Diego (+19.4 percent), Pittsburgh (+15.0 percent), Orlando (+12.6 percent), and St. Louis (+11.8 percent).
- Among the Core Based Statistical Areas (CBSAs) tracked by First American, the five markets with the greatest year-over-year decrease in the RHPI are: Las Vegas (-25.6 percent), Providence, R.I. (-13.7 percent), Cleveland (-5.8 percent), Chicago (-4.2 percent), and Boston (-3.4 percent).
About the First American Real House Price Index
The traditional perspective on house prices is fixated on the actual prices and the changes in those prices, which overlooks what matters to potential buyers - their purchasing power, or how much they can afford to buy. First American’s proprietary Real House Price Index (RHPI) adjusts prices for purchasing power by considering how income levels and interest rates influence the amount one can borrow.
The RHPI uses a weighted repeat-sales house price index that measures the price movements of single-family residential properties by time and across geographies, adjusted for the influence of income and interest rate changes on consumer house-buying power. The index is set to equal 100 in January 2000. Changing incomes and interest rates either increase or decrease consumer house-buying power. When incomes rise and mortgage rates fall, consumer house-buying power increases, acting as a deflator of increases in the house price level. For example, if the house price index increases by three percent, but the combination of rising incomes and falling mortgage rates increase consumer buying power over the same period by two percent, then the Real House Price index only increases by 1 percent. The Real House Price Index reflects changes in house prices, but also accounts for changes in consumer house-buying power.
Disclaimer
Opinions, estimates, forecasts and other views contained in this page are those of First American’s Chief Economist, do not necessarily represent the views of First American or its management, should not be construed as indicating First American’s business prospects or expected results, and are subject to change without notice. Although the First American Economics team attempts to provide reliable, useful information, it does not guarantee that the information is accurate, current or suitable for any particular purpose. © 2020 by First American. Information from this page may be used with proper attribution.


