Housing market potential sagged to its lowest point since May 2020 in September, falling 3.6 percent from August to an estimated 5.38 million at a seasonally adjusted annualized rate (SAAR). Year over year, the market potential for existing-home sales is down 16.7 percent. Market dynamics and the broader economic outlook have changed dramatically in the last 12 months, and that has strongly influenced the fundamentals that drive buyer and seller behavior and the potential for existing-home sales compared with a year ago.
"The higher the mortgage rate, the more sellers will go on strike and the more potential buyers will feel the impact of reduced house-buying power, but price appreciation will further slow and potential buyers can use adjustable-rate mortgages to regain some of that lost house-buying power."
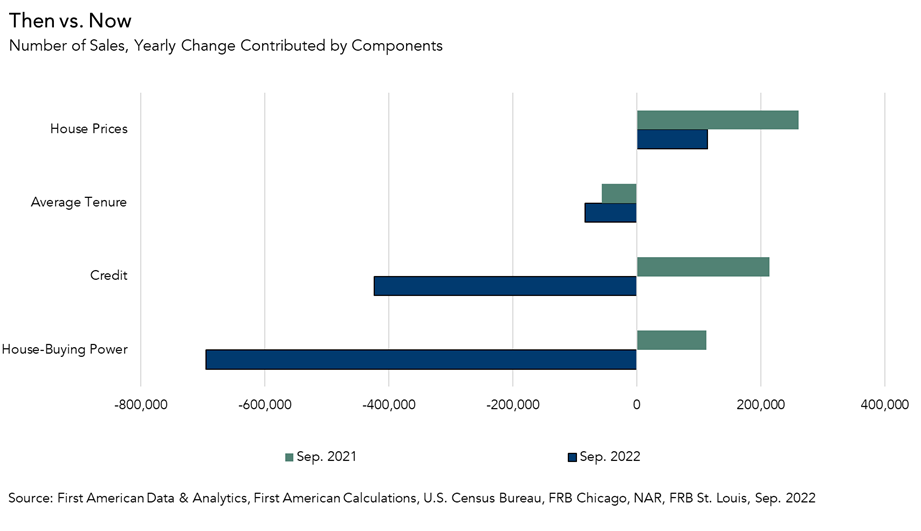
Then vs. Now
In September 2021, which marked the highest level for housing market potential since 2007, the average 30-year fixed mortgage rate was 2.9 percent. Since then, average mortgage rates have increased to 6.1 percent in September of this year and they have continued to drift higher in October, approaching 7 percent. Higher mortgage rates have a dual effect on the housing market. First, rising rates reduce home-buying power, all else held equal, dampening home-buying demand and decreasing the market potential for existing-home sales. House-buying power is down 29 percent compared with September 2021. The decline of house-buying power has reduced market potential by 695,000 home sales.
Higher mortgage rates also incentivize homeowners to stay put by strengthening the rate “lock-in” effect. Consider that 93 percent of outstanding mortgages had mortgage rates below 6 percent in the second quarter of 2022. As mortgage rates approach 7 percent and the gap between most homeowners current mortgage rate and the prevailing market rate grows, the financial disincentive for homeowners to sell their homes and buy a new home at the higher prevailing mortgage rate increases. The rate lock-in effect prevents more new supply from reaching the market and reduces the number of home sales. Homeowners staying put reduced housing market potential by 84,000 sales in September compared with one year ago.
The other factor that is different today compared with one year ago is an uncertain economic landscape, and that is reflected in tighter credit conditions. When lending standards are tight, fewer people can qualify for a mortgage to buy a home. Tighter credit conditions resulted in 424,000 fewer potential home sales compared to one year ago.
While house price growth is slowing as the housing market cools, prices still remain higher than one year ago and homeowners, in aggregate, have historically high levels of home equity. For some of those equity-rich homeowners, that means moving and taking on a higher mortgage rate isn’t a huge deal—especially if they are moving to a more affordable city. Higher home prices compared with one year ago boosted housing market potential by 113,500 home sales in September.
What’s Next?
It’s clear that lower mortgage rates super-charged housing market potential in 2021, but what’s next for potential home sales now that rates are rising? Falling house-buying power combined with tighter credit conditions have been the largest factors sapping potential demand. As long as inflation remains high, there will be upward pressure on mortgage rates as the Federal Reserve continues to aggressively tighten monetary policy. The higher the mortgage rate, the more sellers will go on strike and the more potential buyers will feel the impact of reduced house-buying power, but price appreciation will further slow and potential buyers can use adjustable-rate mortgages to regain some of that lost house-buying power. While not the frenzy of 2021, the largest living generation, the millennials, will continue to age into their prime home-buying years, creating a demographic tailwind for the housing market.
September 2022 Potential Home Sales
For the month of September, First American updated its proprietary Potential Home Sales Model to show that:
- Potential existing-home sales decreased to a 5.38 million seasonally adjusted annualized rate (SAAR), a 3.6 percent month-over-month decrease.
- This represents a 54.4 percent increase from the market potential low point reached in February 1993.
- The market potential for existing-home sales decreased 16.7 percent compared with a year ago, a loss of 1,080,000 (SAAR) sales.
- Currently, potential existing-home sales is 1,409,000 (SAAR), or 20.7 percent below the pre-recession peak of market potential, which occurred in April 2006.
First American Deputy Chief Economist Odeta Kushi contributed to this post.
What Insight Does the Potential Home Sales Model Reveal?
When considering the right time to buy or sell a home, an important factor in the decision should be the market’s overall health, which is largely a function of supply and demand. Knowing how close the market is to a healthy level of activity can help consumers determine if it is a good time to buy or sell, and what might happen to the market in the future. That is difficult to assess when looking at the number of homes sold at a particular point in time without understanding the health of the market at that time. Historical context is critically important. Our potential home sales model measures what we believe a healthy market level of home sales should be based on the economic, demographic and housing market environments.
About the Potential Home Sales Model
Potential home sales measures existing-home sales, which include single-family homes, townhomes, condominiums and co-ops on a seasonally adjusted annualized rate based on the historical relationship between existing-home sales and U.S. population demographic data, homeowner tenure, house-buying power in the U.S. economy, price trends in the U.S. housing market, and conditions in the financial market. When the actual level of existing-home sales are significantly above potential home sales, the pace of turnover is not supported by market fundamentals and there is an increased likelihood of a market correction. Conversely, seasonally adjusted, annualized rates of actual existing-home sales below the level of potential existing-home sales indicate market turnover is underperforming the rate fundamentally supported by the current conditions. Actual seasonally adjusted annualized existing-home sales may exceed or fall short of the potential rate of sales for a variety of reasons, including non-traditional market conditions, policy constraints and market participant behavior. Recent potential home sale estimates are subject to revision to reflect the most up-to-date information available on the economy, housing market and financial conditions. The Potential Home Sales model is published prior to the National Association of Realtors’ Existing-Home Sales report each month.


