In September 2019, the housing market performed to its potential, as actual existing-home sales were a marginal 0.04 percent, or an estimated 2,340 seasonally adjusted annualized sales, below market potential. Housing market potential decreased relative to last month, but increased 3.8 percent compared with September of last year. Indeed, in September of last year, rising mortgage rates dampened market potential and existing-home sales underperformed market potential by 7.2 percent, or an estimated 445,200 sales. The market dynamics and outlook has improved significantly in the last 12 months, begging the question: what’s changed?
“Lower mortgage rates have a dual effect on the housing market: they incentivize homeowners to move as the rate 'lock-in' effect fades and they boost demand by making homes more affordable.”
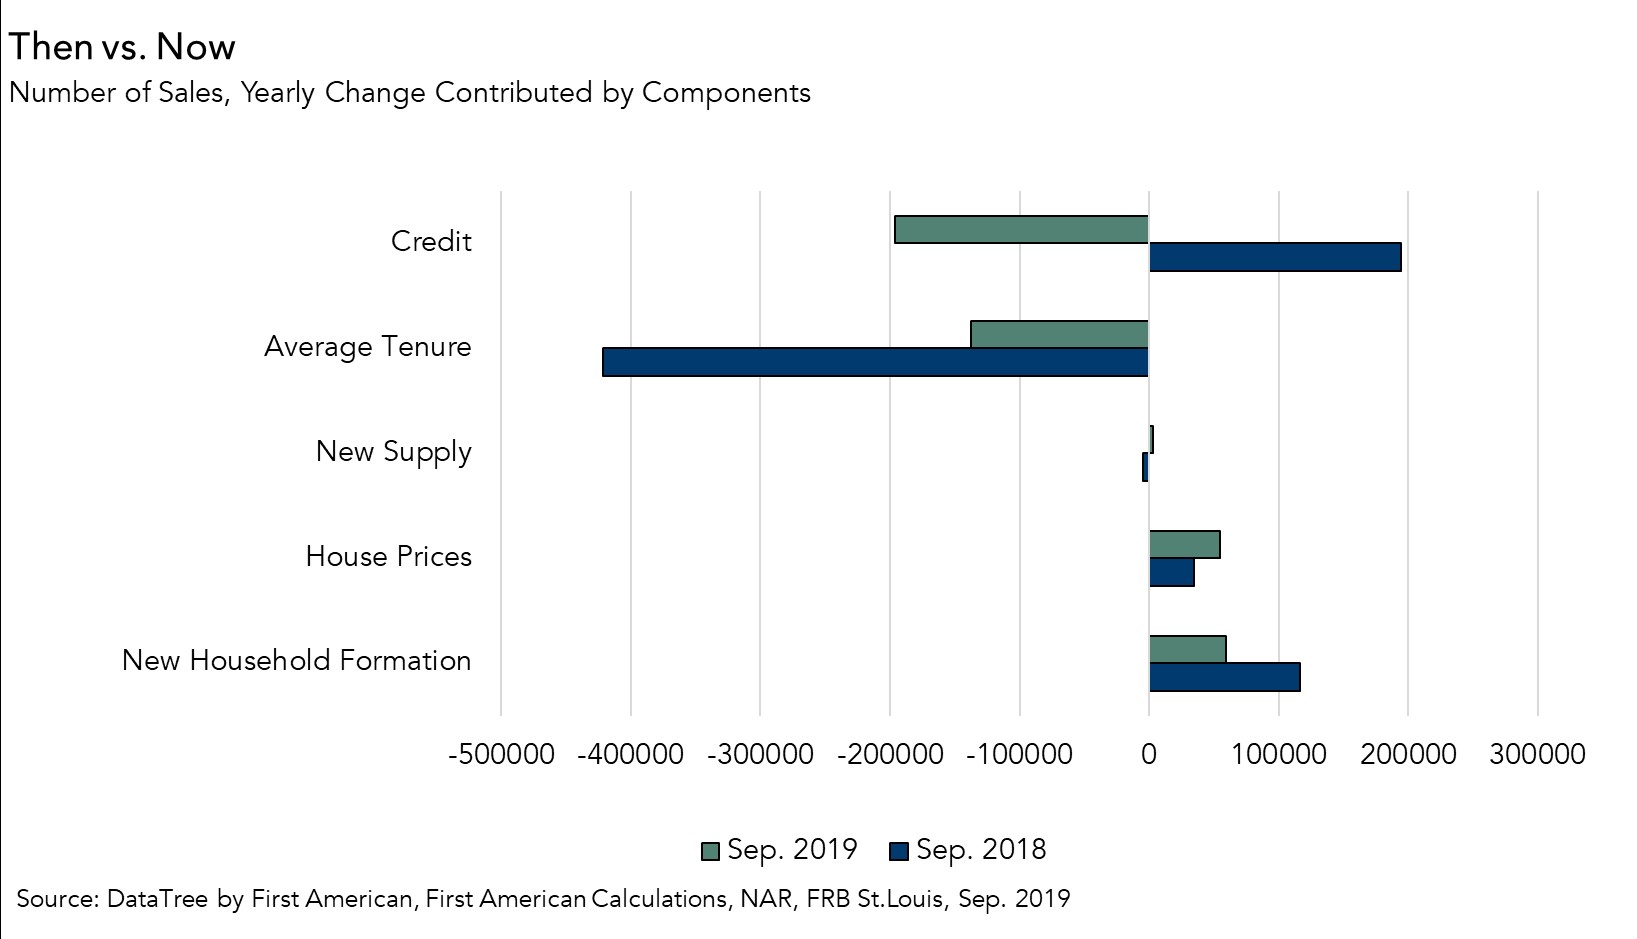
Then vs. Now
In September 2018, the 30-year, fixed-rate mortgage was 4.63 percent and reached a high of 4.87 percent in November. Today, mortgage rates are more than one percentage point lower than one year ago, and 1.26 percentage points lower than the November 2018 zenith. In September of last year, rates were forecasted to continue to rise, as many experts believed the Federal Reserve would continue to increase the Federal Funds rate and put more upward pressure on mortgage rates. Rising rates reduce home-buying power and decrease market potential for existing-home sales.
But, in December 2018, the unexpected happened – volatility in the bond market helped drive mortgage rates lower. This trend has continued through most of 2019 and mortgage rates are now near historically low levels. Lower mortgage rates have a dual effect on the housing market: they incentivize homeowners to move as the rate “lock-in” effect fades, which slows or reduces the average tenure of homeowners, and they boost demand by making homes more affordable.
Drag on Market Potential from Tenure Length Reduced Dramatically
Changes in tenure length are largely the result of the strength of the rate “lock-in” effect, and seniors aging in place. The year-over-year growth in tenure length has been slowing since March of this year and it is conceivable that it could stabilize or even decline, if mortgage rates continue to trend lower. In September 2019, the impact of increasing tenure length on market potential resulted in a loss of 137,230 potential home sales, but that is dramatically less than the 421,260 in September of last year.
Affordability Boosts Market Potential
In 2019, housing affordability benefitted from lower mortgage rates and higher incomes driven by the strong labor market. In September 2019, house-buying power increased to $420,250, 15 percent higher than one year ago. The boost to house-buying power increased the market potential by 415,090 home sales, more than 10 times the annual gain in market potential boost of just 34,390 potential home sales in September 2018.
What’s the Outlook for the Rest of 2019?
Housing is the most durable consumer good we’ll ever buy, and surging house-buying power fuels greater potential demand. You can’t buy what’s not for sale, but rising existing-home sales means more homes on the market, helping to meet the growing demand. While several factors may trigger a directional switch for market potential, the current environment of low mortgage rates and wage growth driven by a strong labor market, supports a healthy housing market for the remainder of 2019.
September 2019 Potential Home Sales
For the month of September, First American updated its proprietary Potential Home Sales Model to show that:
- Potential existing-home sales decreased to a 5.48 million seasonally adjusted annualized rate (SAAR), a 0.02 percent month-over-month decrease.
- This represents a 63.2 percent increase from the market potential low point reached in February 1993.
- The market potential for existing-home sales increased by 3.8 percent compared with a year ago, a gain of 198,800 (SAAR) sales.
- Currently, potential existing-home sales is 1.25 million (SAAR), or 18.6 percent below the pre-recession peak of market potential, which occurred in March 2004.
Market Performance Gap
- The market for existing-home sales is marginally underperforming its potential by 0.04 percent or an estimated 2,340 (SAAR) sales.
- The market performance gap decreased by an estimated 94,000 (SAAR) sales between August 2019 and September 2019.
First American Deputy Chief Economist Odeta Kushi contributed to this post.
What Insight Does the Potential Home Sales Model Reveal?
When considering the right time to buy or sell a home, an important factor in the decision should be the market’s overall health, which is largely a function of supply and demand. Knowing how close the market is to a healthy level of activity can help consumers determine if it is a good time to buy or sell, and what might happen to the market in the future. That is difficult to assess when looking at the number of homes sold at a particular point in time without understanding the health of the market at that time. Historical context is critically important. Our potential home sales model measures what we believe a healthy market level of home sales should be based on the economic, demographic and housing market environments.
About the Potential Home Sales Model
Potential home sales measures existing-homes sales, which include single-family homes, townhomes, condominiums and co-ops on a seasonally adjusted annualized rate based on the historical relationship between existing-home sales and U.S. population demographic data, homeowner tenure, house-buying power in the U.S. economy, price trends in the U.S. housing market, and conditions in the financial market. When the actual level of existing-home sales are significantly above potential home sales, the pace of turnover is not supported by market fundamentals and there is an increased likelihood of a market correction. Conversely, seasonally adjusted, annualized rates of actual existing-home sales below the level of potential existing-home sales indicate market turnover is underperforming the rate fundamentally supported by the current conditions. Actual seasonally adjusted annualized existing-home sales may exceed or fall short of the potential rate of sales for a variety of reasons, including non-traditional market conditions, policy constraints and market participant behavior. Recent potential home sale estimates are subject to revision to reflect the most up-to-date information available on the economy, housing market and financial conditions. The Potential Home Sales model is published prior to the National Association of Realtors’ Existing-Home Sales report each month.


