The housing market’s historic rebound since bottoming in the spring has been nothing short of amazing. After falling to a near-decade low in May, existing-home sales hit a 14-year high in September. In October, our measure of market potential for existing-home sales increased 9.0 percent compared with one year ago to a 5.98 million seasonally adjusted annualized rate (SAAR) of sales, nearly 21 percent higher than its low point in April of this year. This is an unprecedented swing in housing market potential in just a few short months. Analyzing the individual economic forces that have driven the recovery of market potential for existing home sales can provide insight into how the housing market may fare in 2021.
“The boost from loosening credit, along with rising house-buying power, equity and household formation, was strong enough to overcome the negative impact on housing market potential from the increase in tenure length so far in 2020.”
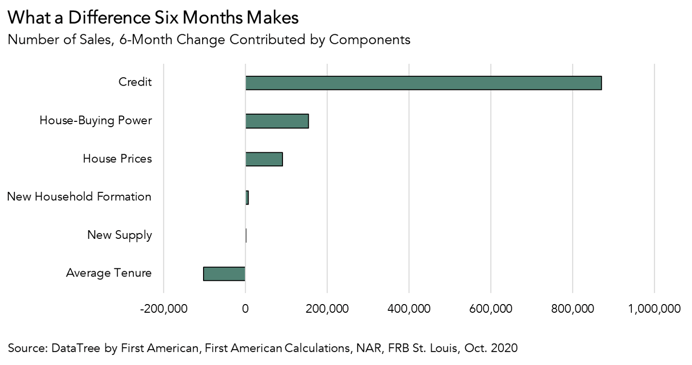
Understanding the Historic Rebound in Housing Market Potential
- Credit Standards Loosened: When lending standards are tight, fewer people can qualify for a mortgage to buy a home, and when homeowners are less likely to qualify for a mortgage for a new home or qualify for a low mortgage rate, they are more likely to stay in their current home. When the pandemic hit, lenders tightened their lending criteria to account for the greater likelihood of forbearance and delinquency. In October, credit loosened compared with April, when the index indicated the tightest conditions in over a decade, as the economy has partially recovered, increasing housing market potential by approximately 871,300 potential home sales.
- House-Buying Power Increased Nearly 8.0 Percent: House-buying power, how much home one can afford to buy given household income and the prevailing mortgage rate, jumped 7.8 percent since April 2020. The dramatic increase in house-buying power had the second greatest impact on housing market potential, boosting market potential by nearly 154,000 potential home sales. The house-buying power surge was driven by the combined impact of lower mortgage rates, which were 0.48 percentage points lower in October than they were in April, and a 1.5 percent increase in annual household income for those still employed.
- Rapid House Price Appreciation: As homeowners gain equity in their homes, they are more likely to consider using the equity to purchase a larger or more attractive home. The historic imbalance in housing supply relative to demand intensified in the summer and fall, fueling faster house price appreciation, which increased housing market potential by nearly 91,000 potential home sales in October compared with April.
- Household Formation Growth Continued: Household formation continued to grow during the pandemic, largely driven by millennials, accelerating demand for housing. The increase in household formation enhanced market potential by nearly 7,000 potential home sales in October compared with April.
The Only Economic Force that Reduced Housing Market Potential
- Tenure Length Sets Records: Tenure length, the average length of time someone lives in their home, continues to reach historic levels, exceeding 10 years in October, according to DataTree by First American. The increase in tenure length had the only negative impact on housing market potential compared with April, reducing it by 102,700 potential home sales. Rising tenure length means fewer and fewer people are listing their homes for sale, keeping housing supply tight. The dearth of supply is the primary constraint to housing market potential, because you can’t buy what’s not for sale.
What Does This Mean for Market Potential in 2021?
After hitting a low point in the spring, the housing market staged a dramatic comeback. The boost from loosening credit, along with rising house-buying power, equity and household formation, was strong enough to overcome the negative impact on housing market potential from the increase in tenure length so far in 2020. In 2021, tenure length appears poised to continue to rise, which will prolong the housing supply shortage and dampen housing market potential. Mortgage rates are anticipated to remain low and millennials are widely expected to continue to form households, boosting demand for homes.
The trend in housing market potential will likely depend on the labor market’s recovery and how lenders adjust credit standards. Will the labor market continue to recover or weaken in the coming months as we battle the pandemic, and will any labor market weakness impact potential home buyers? If there is more uncertainty, will lenders tighten credit once more? The historic rebound in housing market potential will slow down if lenders won’t lend and consumers can’t spend.
October 2020 Potential Home Sales
For the month of October, First American updated its proprietary Potential Home Sales Model to show that:
- Potential existing-home sales decreased to a 5.98 million seasonally adjusted annualized rate (SAAR), a .06 percent month-over-month decrease.
- This represents a 71.5 percent increase from the market potential low point reached in February 1993.
- The market potential for existing-home sales increased 9.0 percent compared with a year ago, a gain of nearly 493,720 (SAAR) sales.
- Currently, potential existing-home sales is 810,750 million (SAAR), or 11.9 percent below the pre-recession peak of market potential, which occurred in April 2006.
Market Performance Gap
- The market for existing-home sales outperformed its potential by 0.7 percent or an estimated 40,495 (SAAR) sales.
- The market performance gap decreased by an estimated 139,751 (SAAR) sales between September 2020 and October 2020.
First American Deputy Chief Economist Odeta Kushi contributed to this post.
What Insight Does the Potential Home Sales Model Reveal?
When considering the right time to buy or sell a home, an important factor in the decision should be the market’s overall health, which is largely a function of supply and demand. Knowing how close the market is to a healthy level of activity can help consumers determine if it is a good time to buy or sell, and what might happen to the market in the future. That is difficult to assess when looking at the number of homes sold at a particular point in time without understanding the health of the market at that time. Historical context is critically important. Our potential home sales model measures what we believe a healthy market level of home sales should be based on the economic, demographic and housing market environments.
About the Potential Home Sales Model
Potential home sales measures existing-home sales, which include single-family homes, townhomes, condominiums and co-ops on a seasonally adjusted annualized rate based on the historical relationship between existing-home sales and U.S. population demographic data, homeowner tenure, house-buying power in the U.S. economy, price trends in the U.S. housing market, and conditions in the financial market. When the actual level of existing-home sales are significantly above potential home sales, the pace of turnover is not supported by market fundamentals and there is an increased likelihood of a market correction. Conversely, seasonally adjusted, annualized rates of actual existing-home sales below the level of potential existing-home sales indicate market turnover is underperforming the rate fundamentally supported by the current conditions. Actual seasonally adjusted annualized existing-home sales may exceed or fall short of the potential rate of sales for a variety of reasons, including non-traditional market conditions, policy constraints and market participant behavior. Recent potential home sale estimates are subject to revision to reflect the most up-to-date information available on the economy, housing market and financial conditions. The Potential Home Sales model is published prior to the National Association of Realtors’ Existing-Home Sales report each month.


