In October 2019, the housing market exceeded its potential, as actual existing-home sales exceeded market potential by 4.6 percent, or an estimated 239,000 seasonally adjusted annualized sales. Housing market potential decreased relative to last month, but increased 0.6 percent compared with October of last year.
“The market potential for existing-home sales in 2020 will largely depend on the strength of the rate lock-in effect and whether house-buying power can increase sufficiently to offset it.”
Two forces drove the month-over-month decline in the potential for existing-home sales – a month-over-month decline of 0.8 percent in consumer house-buying power, the first decline since November 2018, and the continued impact of rising tenure length. The decline in house-buying power dampened market potential substantially. Examining how house-buying power influences market potential can provide insight into the outlook for the housing market.
First Monthly Rate Increase Since November 2018 Holds Back Housing Market Potential
In 2019, consumer house-buying power, how much home one can afford to buy given household income and the prevailing mortgage rates, surged and provided a significant boost to housing market potential. Since the start of 2019, income has grown by 1.9 percent and mortgage rates have fallen by 0.77 percentage points, both dynamics sending house-buying power higher. As a result, house-buying power jumped 12.0 percent between January and October 2019.
In October, mortgage rates increased by 0.08 percentage points, the first monthly increase since November 2018. While household income increased by 0.2 percent compared with one month ago, it was not enough to offset the negative impact of the increase in mortgage rates on house-buying power. The resulting decline in house-buying power dropped the market potential for existing-home sales by nearly 22,000 sales.
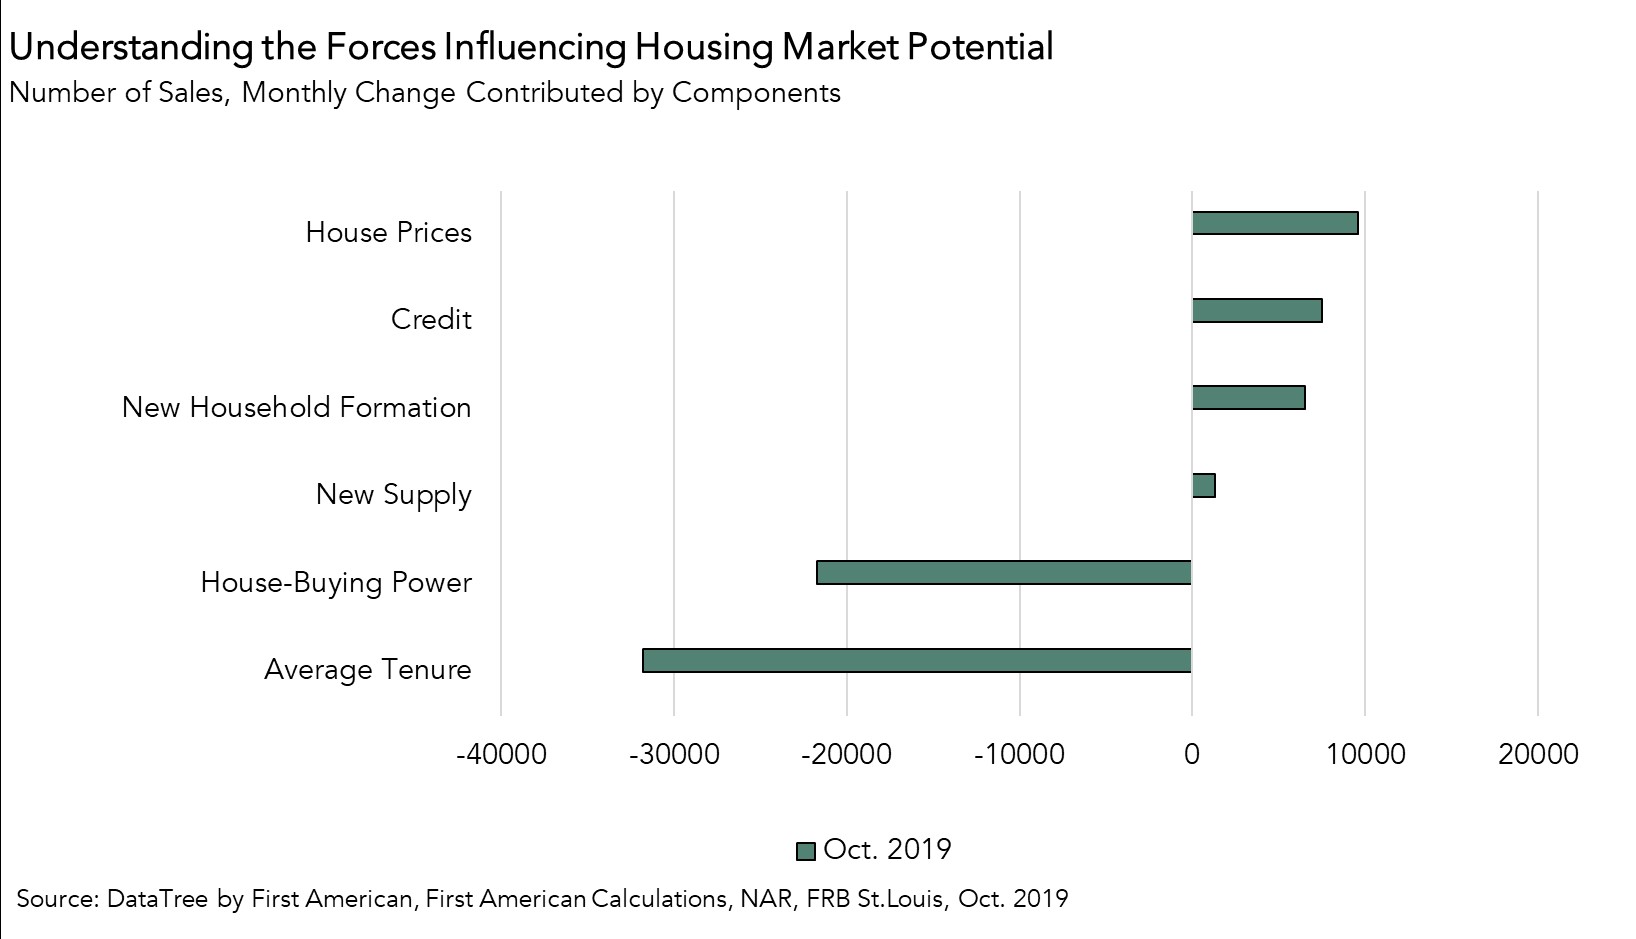
Tenure length, the average length of time someone lives in their home, increased in October by 6.0 percent compared with January 2019, and 0.7 percent compared with last month. Increasing tenure length reduced the market potential for existing-home sales by 31,800. Tenure length and house-buying power are two of the most influential forces on market potential, and they combined to drag down the market potential for existing-home sales by 0.6 percent compared with last month, despite positive contributions from new home construction (1,300 potential home sales), looser credit standards (7,500 potential home sales), rising house prices (9,600 potential home sales), and increasing household formation (6,500 potential home sales).
Impact on 2020 Outlook
One month of declining house-buying power is not a trend. Mortgage rates are currently hovering at 3.7 percent, and forecasters currently expect rates will remain somewhere between 3.7 percent to 3.9 percent in 2020 – still near historical lows. Meanwhile, household income is expected to continue to grow as wages rise. It’s possible that house-buying power in 2020 may dip lower than in the spring and summer of 2019, but will likely remain near historical highs.
As more buyers purchase homes with historically low rates and existing owners refinance, there will be more homeowners with a financial incentive to keep their current homes, and low mortgage rates, and not sell. This is the rate lock-in effect, and it means tenure length will likely continue to rise as well. The market potential for existing-home sales in 2020 will largely depend on the strength of the rate lock-in effect and whether house-buying power can increase sufficiently to offset it.
October 2019 Potential Home Sales
For the month of October, First American updated its proprietary Potential Home Sales Model to show that:
- Potential existing-home sales decreased to a 5.17 million seasonally adjusted annualized rate (SAAR), a 0.6 percent month-over-month decrease.
- This represents a 54.0 percent increase from the market potential low point reached in February 1993.
- The market potential for existing-home sales increased by 0.6 percent compared with a year ago, a gain of 33,050 (SAAR) sales.
- Currently, potential existing-home sales is 1.56 million (SAAR), or 23.1 percent below the pre-recession peak of market potential, which occurred in March 2004.
Market Performance Gap
- The market for existing-home sales outperformed its potential by 4.6 percent or an estimated 239,000 (SAAR) sales.
- The market performance gap increased by an estimated 92,680 (SAAR) sales between September 2019 and October 2019.
First American Deputy Chief Economist Odeta Kushi contributed to this post.
What Insight Does the Potential Home Sales Model Reveal?
When considering the right time to buy or sell a home, an important factor in the decision should be the market’s overall health, which is largely a function of supply and demand. Knowing how close the market is to a healthy level of activity can help consumers determine if it is a good time to buy or sell, and what might happen to the market in the future. That is difficult to assess when looking at the number of homes sold at a particular point in time without understanding the health of the market at that time. Historical context is critically important. Our potential home sales model measures what we believe a healthy market level of home sales should be based on the economic, demographic and housing market environments.
About the Potential Home Sales Model
Potential home sales measures existing-homes sales, which include single-family homes, townhomes, condominiums and co-ops on a seasonally adjusted annualized rate based on the historical relationship between existing-home sales and U.S. population demographic data, homeowner tenure, house-buying power in the U.S. economy, price trends in the U.S. housing market, and conditions in the financial market. When the actual level of existing-home sales are significantly above potential home sales, the pace of turnover is not supported by market fundamentals and there is an increased likelihood of a market correction. Conversely, seasonally adjusted, annualized rates of actual existing-home sales below the level of potential existing-home sales indicate market turnover is underperforming the rate fundamentally supported by the current conditions. Actual seasonally adjusted annualized existing-home sales may exceed or fall short of the potential rate of sales for a variety of reasons, including non-traditional market conditions, policy constraints and market participant behavior. Recent potential home sale estimates are subject to revision to reflect the most up-to-date information available on the economy, housing market and financial conditions. The Potential Home Sales model is published prior to the National Association of Realtors’ Existing-Home Sales report each month.


