In March, housing affordability declined, snapping a four-month streak of increasing affordability. The decline in March occurred as two of the three key drivers of the Real House Price Index (RHPI), nominal house prices and mortgage rates, moved higher, decreasing house-buying power by 2.7 percent and dragging affordability down relative to one month ago.
“Affordability trends in the coming months will depend on mortgage rates and the supply and demand dynamics fueling nominal house price appreciation – dynamics that will play out differently in each market. Real estate affordability is local too.”
While median household incomes increased by 0.3 percent compared with February, it was not enough to offset the affordability dampening impact from a 0.4 percent increase in nominal house prices and a 0.3 percentage point increase in mortgage rates. As always, real estate is local and national affordability trends often diverge from local trends.
Where Did Affordability Decline the Most?
Mortgage rates are generally the same across the country, so an increase in mortgage rates reduces affordability equally in each market. On the other hand, the components of house-buying power – household income growth and nominal house prices – differ from market to market, so the affordability dynamic varies as well.
Affordability declined month over month in all of the 50 markets we track, but some markets saw a much sharper decline than others. The five markets with the greatest month-over-month decline in affordability were:
- Kansas City, Mo. (6.1 percent)
- St. Louis, Mo. (6.0 percent)
- Buffalo, N.Y. (5.7 percent)
- Sacramento, Calif. (5.1 percent)
- Columbus, Ohio (4.9 percent)
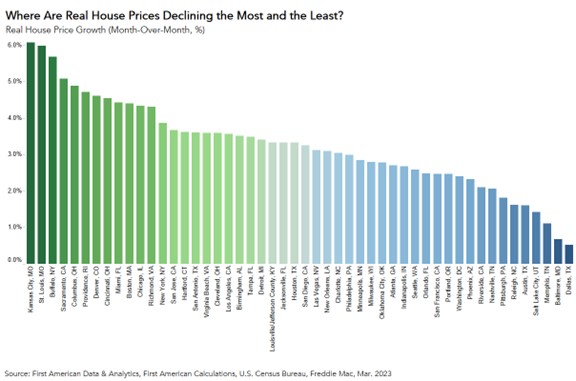
In March, Kansas City had the greatest month-over-month decrease in affordability. While monthly income growth was positive at 0.3 percent, nominal house prices in Kansas City jumped 3.2 percent from February, one of the largest increases among the five markets where affordability declined the most. The steep monthly increase in nominal house prices overshadowed any affordability gains from increased income. A very similar dynamic played out in St. Louis.
Affordability in Buffalo declined by 5.7 percent on a month-over-month basis, driven by a 2.6 percent increase in nominal house prices. Unlike Kansas City and St. Louis, however, household income growth was flat in Buffalo. Income growth is a powerful factor in the affordability equation. The last two markets to round out the top five markets where affordability declined the most were Columbus and Sacramento. In these markets, not only did nominal house price growth accelerate by 1.3 percent and 0.2 percent, respectively, but household income declined on a monthly basis.
Where are Nominal House Prices Headed?
Mortgage rates in today’s market remain significantly elevated compared with one year ago, which should prompt nominal house prices to adjust downward. Yet, housing supply remains so restricted, that any uptick in demand will put upward pressure on prices. This is the dynamic that played out in March, as the spring home-buying season ushered in more demand for homes, while insufficient supply prompted buyers to compete and bid up prices. Affordability trends in the coming months will depend on mortgage rates and the supply and demand dynamics fueling nominal house price appreciation – dynamics that will play out differently in each market. Real estate affordability is local too.
For more analysis of affordability, please visit the Real House Price Index. The RHPI is updated monthly with new data. Look for the next edition of the RHPI the week of June 26, 2023.
Sources:
March 2023 Real House Price Index Highlights
The First American Real House Price Index (RHPI) showed that in March 2023:
- Real house prices increased 3.2 percent between February 2023 and March 2023.
- Real house prices increased 28 percent between March 2022 and March 2023.
- Consumer house-buying power, how much one can buy based on changes in income and mortgage rates, decreased 2.7 percent between February 2023 and March 2023, and decreased 20.1 percent year over year.
- Median household income has increased 4.1 percent since January 2022 and 81.4 percent since January 2000.
- Real house prices are 37.1 percent more expensive than in January 2000.
- Unadjusted house prices are now 50 percent above the housing boom peak in 2006, while real, house-buying power-adjusted house prices are 4.1 percent below their 2006 housing boom peak.
March 2023 Real House Price State Highlights
- The five states with the greatest year-over-year increase in the RHPI are: Illinois (+35.5 percent), Vermont (+35.3 percent), Maryland (+35.1 percent), Wisconsin (+35.0 percent), and Iowa (+34.9 percent).
- There were no states with a year-over-year decrease in the RHPI.
March 2023 Real House Price Local Market Highlights
- Among the Core Based Statistical Areas (CBSAs) tracked by First American, the five markets with the greatest year-over-year increase in the RHPI are: Miami (+45.6 percent), St. Louis (+40.5 percent), Dallas (+39.6 percent), Jacksonville, Fla. (+37.7 percent), and San Antonio (+37.0 percent).
- Among the Core Based Statistical Areas (CBSAs) tracked by First American, there were no markets with a year-over-year decrease in the RHPI.
About the First American Real House Price Index
The traditional perspective on house prices is fixated on the actual prices and the changes in those prices, which overlooks what matters to potential buyers - their purchasing power, or how much they can afford to buy. First American’s proprietary Real House Price Index (RHPI) adjusts prices for purchasing power by considering how income levels and interest rates influence the amount one can borrow.
The RHPI uses a weighted repeat-sales house price index that measures the price movements of single-family residential properties by time and across geographies, adjusted for the influence of income and interest rate changes on consumer house-buying power. The index is set to equal 100 in January 2000. Changing incomes and interest rates either increase or decrease consumer house-buying power. When incomes rise and mortgage rates fall, consumer house-buying power increases, acting as a deflator of increases in the house price level. For example, if the house price index increases by three percent, but the combination of rising incomes and falling mortgage rates increase consumer buying power over the same period by two percent, then the Real House Price index only increases by 1 percent. The Real House Price Index reflects changes in house prices, but also accounts for changes in consumer house-buying power.
Disclaimer
Opinions, estimates, forecasts and other views contained in this page are those of First American’s Chief Economist, do not necessarily represent the views of First American or its management, should not be construed as indicating First American’s business prospects or expected results, and are subject to change without notice. Although the First American Economics team attempts to provide reliable, useful information, it does not guarantee that the information is accurate, current or suitable for any particular purpose. © 2023 by First American. Information from this page may be used with proper attribution.


