While still 4 percent higher than one year ago, the market potential for existing-home sales declined to its lowest level since June 2021, according to the first Potential Home Sales Model report of 2022. Demand for homes will remain strong in 2022, but declining affordability and lack of supply may limit market potential. Potential home buyers have little inventory to select from, and you can’t buy what’s not for sale. Rebalancing of demand relative to the short supply is likely as demand moderates due to declining affordability, and house price appreciation slows down in response.
"Housing market potential this year will depend on the degree to which potential first-time home buyers respond to changes in their house-buying power and homeowners’ decisions to list their homes for sale."
Rebalancing Forces in the Housing Market:
- Rising Rates Reduce Affordability: In January, the 30-year, fixed mortgage rate experienced its largest one-month jump since December 2016. The 35-basis point increase in mortgage rates contributed to a $19,000 decline in house-buying power, which reduced housing market potential by 90,000 potential home sales. Mortgage rates have continued to drift upward in February and are expected to rise further in 2022. While the decision to purchase a home is not strictly financial, higher rates reduce house-buying power (all else held equal) and may force some potential buyers to lower their price point or to pull back from the market entirely. First-time home buyers will feel the squeeze of rising rates the most as the competition in one of the most competitive housing markets in history is even more pronounced in the lower-priced starter-home segment of the market. Yet, the affordability induced reduction in demand will reduce pressure on prices, given the ongoing supply constraints.
- You Can’t Buy What’s Not for Sale: Potential first-time home buyers have traditionally had access to affordable housing through filtering – a process by which a new home “filters” down to lower relative price tiers as it ages and depreciates in quality. Yet, homeowners today are staying in their homes longer than ever – on average over 10 years – which means fewer homes are filtering down to potential first-time home buyers. Homeowners staying put reduced housing market potential by 7,000 home sales in January. There is limited incentive to sell when, due to higher mortgage rates, it will cost more each month to borrow the same amount as your existing mortgage from a lender, a phenomenon known as the “rate lock-in effect.” The shortage of supply across the price spectrum also impacts existing homeowners looking to move up. To buy a new home, the existing owner first must sell their current home. When supply is constrained like it is in today’s market, it becomes more difficult to find a suitable upgrade.
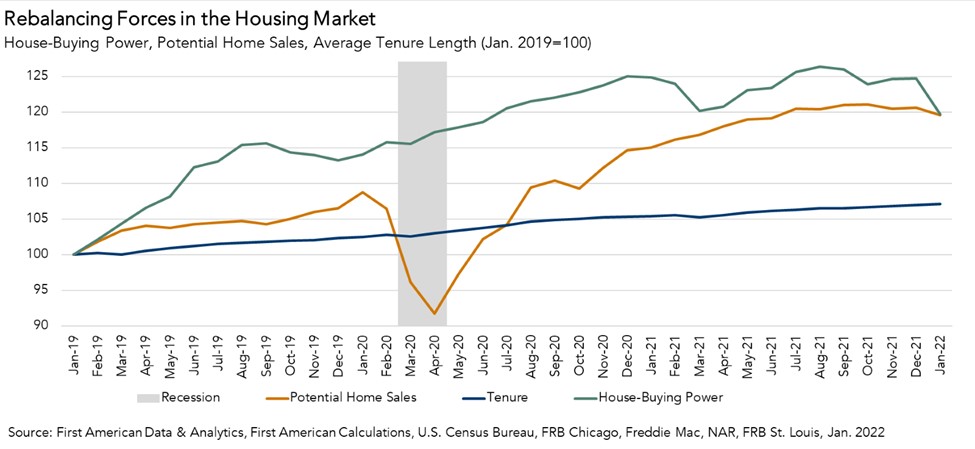
Housing Market Potential Hinges on Opposing Supply-Demand Forces
Rising rates may negatively impact both housing affordability and supply, but it may also result in a housing market rebalancing. Double-digit nominal house price growth in combination with rising rates will cause some buyers to pull back from the market, resulting in fewer and less intense bidding wars and, ultimately, a moderation in house price growth. Another important consideration is that builders have been busy breaking ground on more homes, which will help to alleviate some of the supply shortage this year. Household income is also on the rise, as average annual hourly wage growth remains near a 15-year high, which offsets some of the affordability loss from rising mortgage rates. Housing market potential this year will depend on the degree to which potential first-time home buyers respond to changes in their house-buying power and homeowners’ decisions to supply their homes for sale. One possible outcome? A market that is closer to equilibrium, with less price appreciation than last year.
January 2022 Potential Home Sales
For the month of January, First American updated its proprietary Potential Home Sales Model to show that:
- Potential existing-home sales decreased to a 6.31 million seasonally adjusted annualized rate (SAAR), a 0.9 percent month-over-month decrease.
- This represents a 80.9 percent increase from the market potential low point reached in February 1993.
- The market potential for existing-home sales increased 3.9 percent compared with a year ago, a gain of 238,000 (SAAR) sales.
- Currently, potential existing-home sales is 485,000 (SAAR), or 7.1 percent below the pre-recession peak of market potential, which occurred in April 2006.
Market Performance Gap
- The market for existing-home sales outperformed its potential by 11.9 percent or an estimated 748,000 (SAAR) sales.
- The market performance gap increased by an estimated 124,000 (SAAR) sales between December 2021 and January 2022.
First American Deputy Chief Economist Odeta Kushi contributed to this post.
What Insight Does the Potential Home Sales Model Reveal?
When considering the right time to buy or sell a home, an important factor in the decision should be the market’s overall health, which is largely a function of supply and demand. Knowing how close the market is to a healthy level of activity can help consumers determine if it is a good time to buy or sell, and what might happen to the market in the future. That is difficult to assess when looking at the number of homes sold at a particular point in time without understanding the health of the market at that time. Historical context is critically important. Our potential home sales model measures what we believe a healthy market level of home sales should be based on the economic, demographic and housing market environments.
About the Potential Home Sales Model
Potential home sales measures existing-home sales, which include single-family homes, townhomes, condominiums and co-ops on a seasonally adjusted annualized rate based on the historical relationship between existing-home sales and U.S. population demographic data, homeowner tenure, house-buying power in the U.S. economy, price trends in the U.S. housing market, and conditions in the financial market. When the actual level of existing-home sales are significantly above potential home sales, the pace of turnover is not supported by market fundamentals and there is an increased likelihood of a market correction. Conversely, seasonally adjusted, annualized rates of actual existing-home sales below the level of potential existing-home sales indicate market turnover is underperforming the rate fundamentally supported by the current conditions. Actual seasonally adjusted annualized existing-home sales may exceed or fall short of the potential rate of sales for a variety of reasons, including non-traditional market conditions, policy constraints and market participant behavior. Recent potential home sale estimates are subject to revision to reflect the most up-to-date information available on the economy, housing market and financial conditions. The Potential Home Sales model is published prior to the National Association of Realtors’ Existing-Home Sales report each month.


