As we navigate the unprecedented impact of COVID-19, home has taken on added significance and there are signs that homeownership remains one of the main tenets of the American Dream. After hitting a bottom in the second week of April, mortgage applications to purchase a home increased for nine consecutive weeks, even exceeding levels from a year ago for five straight weeks. Housing may be positioned to lead the recovery, a role it has traditionally played in previous downturns, with the exception of the Great Recession. In the recovery from the Great Recession, the homeownership rate hit a generational low of 63 percent in 2016, but it has been steadily rising since. A combination of demographic and economic factors has driven the steady rise since the low point and remain poised to fuel demand in the years ahead.
"Though the pandemic presents new challenges to achieving homeownership, millennial lifestyle decisions will continue to support potential homeownership demand in the years ahead, meaning millennials may be poised to fuel a 'roaring 20s' of homeownership demand."
The homeownership rate is influenced by underlying demographic and economic factors, as well as housing market conditions. Close examination of these underlying forces can provide a more in-depth understanding of the changes in the homeownership rate over time. Our annual Homeownership Progress Index (HPRI) accounts for the influence of critical lifestyle, societal and economic trends on the likelihood of owning a home. Understanding these factors and tracking how they change over time allows us to measure potential homeownership demand.
Homeownership Rate Continues to Trail Potential Demand
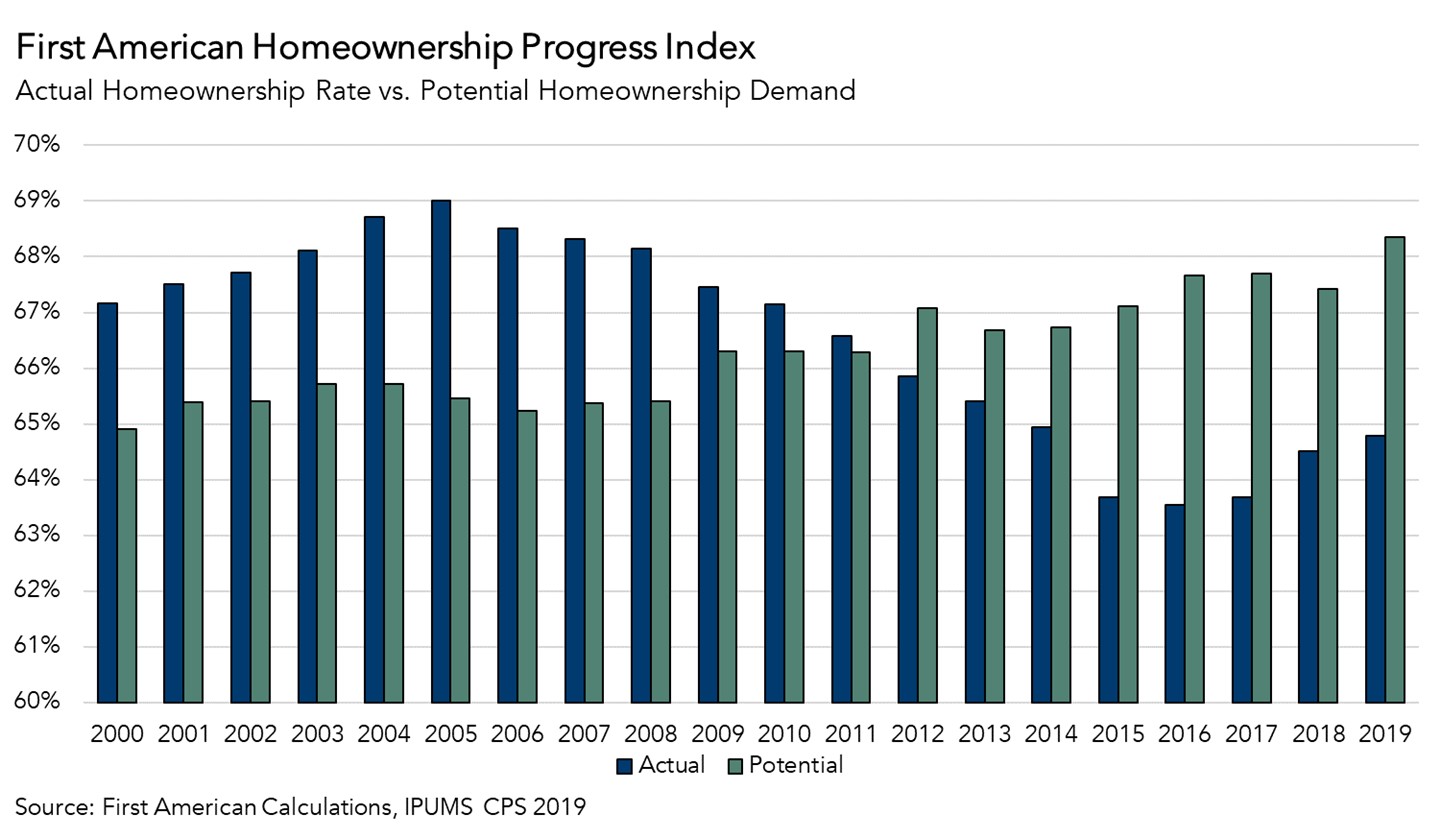
From 2004 through 2008, speculation and easy access to credit caused the actual homeownership rate to exceed potential homeownership demand by an average of 3 percent, peaking at 3.5 percentage points in 2005. The gap then decreased until 2012, which is the first time when potential homeownership demand as measured by the HPRI exceeded the actual homeownership rate. When the HPRI exceeds the actual homeownership rate, it indicates that potential demand for homeownership may be stifled by market forces. Today, the primary constraint on the actual homeownership rate is most likely historically low supply of homes for sale. The reverse indicates that the homeownership rate is above the levels supported by demographic and economic fundamentals and may be pushed higher by speculation or easy access to credit.
Since 2012, potential homeownership demand, based on the lifestyle, societal and economic factors tracked in our HPRI model, has exceeded the actual homeownership rate. Millennial household formation is a major demographic trend driving the increase in potential demand, but rising house-buying power driven by wage growth and persistently low mortgage rates have also helped boost potential demand. Between 2011 and 2018, the annual average of the 30-year, fixed-rate mortgage has been near or below 4.5 percent, significantly below the pre-2011 average of 8.9 percent. In 2019, mortgage rates unexpectedly fell after trending up through much of 2018, helping increase house-buying power and further elevating potential homeownership demand, which exceeded the actual homeownership rate by 3.6 percentage points.
Potential Demand Expected to Grow Despite Economic Downturn
Millennials are the largest generational group in the history of the U.S., and that’s not the only thing that differentiates them from their generational predecessors. Millennials are more diverse, more educated, and have historically chosen to delay critical lifestyle triggers to buying a first home, including getting married and having children, in favor of furthering their educations. However, according to a 2019 survey, 88 percent of millennials believe homeownership is important for personal success, and there are signs that millennials will continue to be a driving force in homeownership demand. It appears millennial homeownership has been delayed, not denied.
For example, in 2019, potential homeownership demand improved, mostly thanks to millennials, those between the ages of 22 and 38 (in 2019). Potential homeownership demand in 2019 increased by three percentage points for millennials, outpacing the gains of Generation X (1.7 percentage points) and Baby Boomers (0.8 percentage points). It’s clear that as millennials form households and begin to make lifestyle decisions, such as getting married and starting families, they are increasingly choosing homeownership over renting.
Despite the pandemic-driven economic downturn in 2020, millennials are still aging, in large numbers, into the key lifestyle decisions that increase the likelihood of homeownership. This year, the largest section of millennials will turn 30, entering their prime homeownership years. Though the pandemic presents new challenges to achieving homeownership, millennial lifestyle decisions will continue to support potential homeownership demand in the years ahead, meaning millennials may be poised to fuel a “roaring 20s” of homeownership demand.
2019 HOMEOWNERSHIP PROGRESS INDEX
Overall National HPRI Increases about one percentage point from 2018 to 2019
The First American Homeownership Progress Index (HPRI) showed that in 2019:
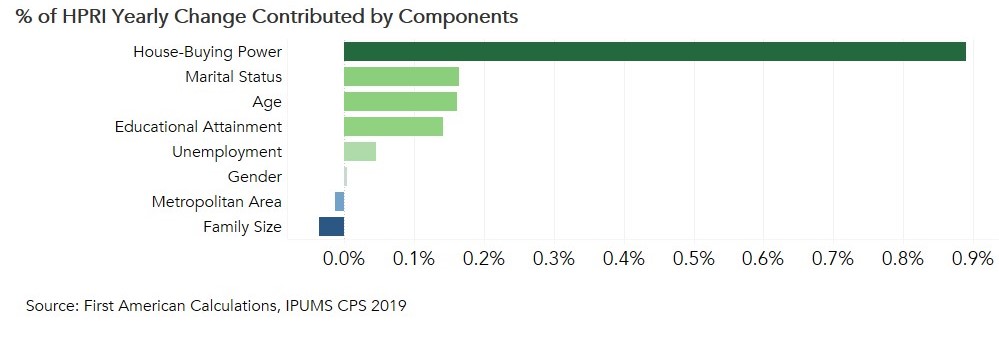
- Nationally, potential homeownership demand represented by the HPRI increased one percentage point in 2019 compared with 2018, based on changes in the underlying lifestyle, societal and economic data.
- Factors that increased potential homeownership demand included house-buying power growth (+0.9 percent), the higher share of married households (+0.2 percent), an aging population (+0.2 percent), rising educational attainment (+0.1 percent), and a decline in the U-6 unemployment rate (+0.04 percent).
- The decline in the number of children per household (-0.04 percent) and the increase in the share of people moving to metropolitan areas (-0.01 percent) were among the factors that decreased potential homeownership demand.
- Potential homeownership demand increased from 2018 to 2019 in 37 of the 50 metropolitan areas tracked by First American, as demographic and economic trends in these cities raised the likelihood of homeownership.
2019 Homeownership Progress Index State Highlights
- The five states with the greatest year-over-year increase in potential homeownership demand are: Massachusetts (+3.5 percentage points), Delaware (+3.1 percentage points), Hawaii (+2.4 percentage points), Kansas (+2.2 percentage points) and Nevada (+2.2 percentage points).
- The states with the greatest year-over-year decrease in potential homeownership demand are: Montana (-0.7 percentage points), Vermont (-0.7 percentage points), Indiana (-0.4 percentage points), Connecticut (-0.4 percentage points), and Texas (-0.3 percentage points).
2019 Homeownership Progress Index Local Market Highlights
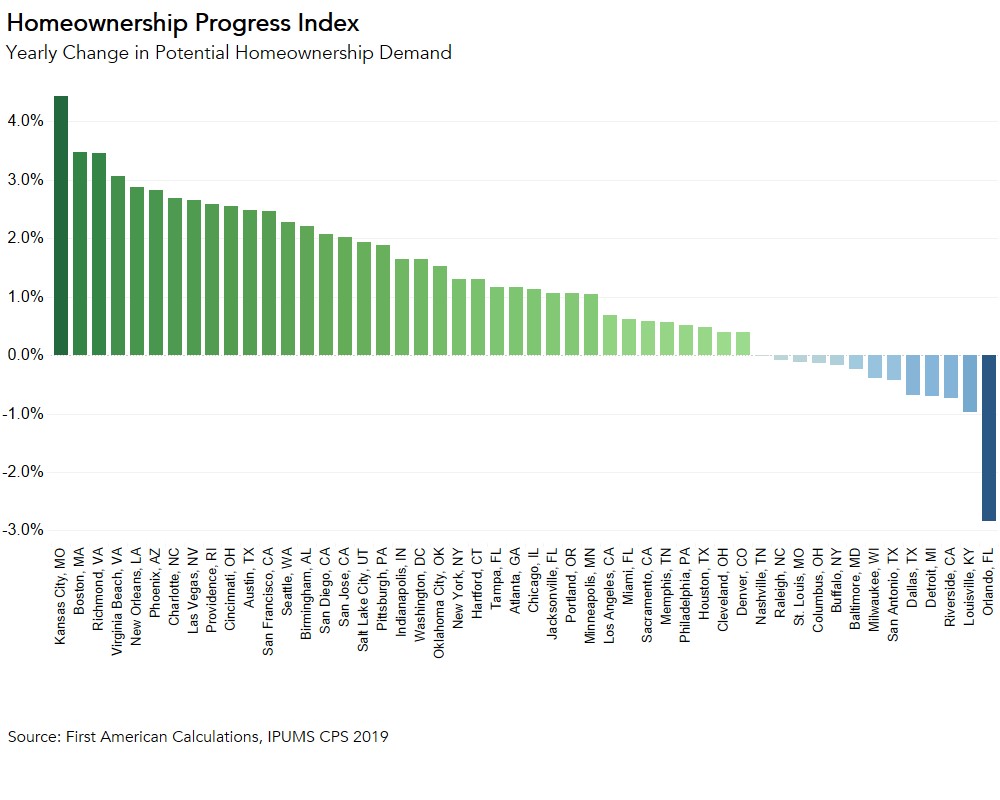
- Among the largest 50 Core Based Statistical Areas (CBSAs), the five markets with the greatest year-over-year increase in potential homeownership demand are: Kansas City, Mo. (+4.4 percentage points), Boston (+3.5 percentage points), Richmond, Va. (+3.5 percentage points), Virginia Beach, Va. (+3.1 percentage points) and New Orleans (+2.9 percentage points).
- Among the largest 50 CBSAs, the markets with the greatest year-over-year decrease in potential homeownership demand are: Orlando, Fla. (-2.8 percentage points), Louisville, Ky. (-1.0 percentage points), Riverside, Calif. (-0.7 percentage points), Detroit (-0.7 percentage points), and Dallas (-0.7 percentage points).
Next Release
The next release of the First American Homeownership Progress Index will be posted in June 2021.
What makes it a Homeownership Progress Index?
Traditional measures of homeownership rates do not account for shifts in underlying demographic or economic factors. Instead, they report just the share of households that are homeowners. Analysis based on these traditionally calculated homeownership rates has resulted in mistaken conclusions that are often propagated as conventional wisdom. The HPRI provides a deeper look into the changes to homeownership rates over time by accounting for, and isolating, the impact of critical lifestyle, societal and economic trends that influence the likelihood of renting or owning a home.
Why does the HPRI tell a different story than other measures?
Changing demographic and economic factors either increase or decrease someone’s potential to be a homeowner. For example, increasing marital rates, household size, educational attainment, income and improving economic conditions all increase potential demand for homeownership. The HPRI measures the potential for homeownership demand based on these underlying factors. For example, the potential for, or likelihood of, homeownership may increase because of rising educational attainment or income growth. It’s important to point out that the likelihood of homeownership doesn’t have to match the actual homeownership rate. For example, it’s possible that someone may be highly likely to desire homeownership but are unable to find any houses they can afford to buy. In that case, potential homeownership demand would be higher than the actual homeownership rate.
What do the HPRI number values mean?
The HPRI value is the percent of households that are likely to be homeowners, based on underlying lifestyle, societal, and economic conditions, instead of renters. Changes over time in the HPRI are caused by changes in the underlying lifestyle, societal and economic trends.
About the First American Homeownership Progress Index
The First American Homeownership Progress Index is an economic model that uses annual IPUMS CPS individual anonymized census survey data to measure the influence of household circumstances and demographic, societal and economic characteristics on one’s choice to own a home. Demographic characteristics include age, race/ethnicity, gender, marital status and number of children. Additionally, the model includes educational attainment, income, the 30-year fixed rate mortgage rate and the unemployment rate to help explain changes in homeownership rates. The individual factors influencing homeownership can be isolated, while all other factors are held equal, to provide a unique perspective on the impact the isolated factor has on the likelihood of homeownership.
The HPRI can provide the likelihood of homeownership for a given demographic and economic profile. For example, an educated man with two children and a higher income will have a higher likelihood of homeownership than a single man without a higher education degree.
Methodology
The methodology statement for the First American Homeownership Progress Index is available at http://www.firstam.com/economics/homeownership-progress-index.
Disclaimer
Opinions, estimates, forecasts and other views contained in this page are those of First American’s Chief Economist, do not necessarily represent the views of First American or its management, should not be construed as indicating First American’s business prospects or expected results, and are subject to change without notice. Although the First American Economics team attempts to provide reliable, useful information, it does not guarantee that the information is accurate, current or suitable for any particular purpose. © 2020 by First American. Information from this page may be used with proper attribution.


