September 2016 Potential Home Sales
This month the model showed that:
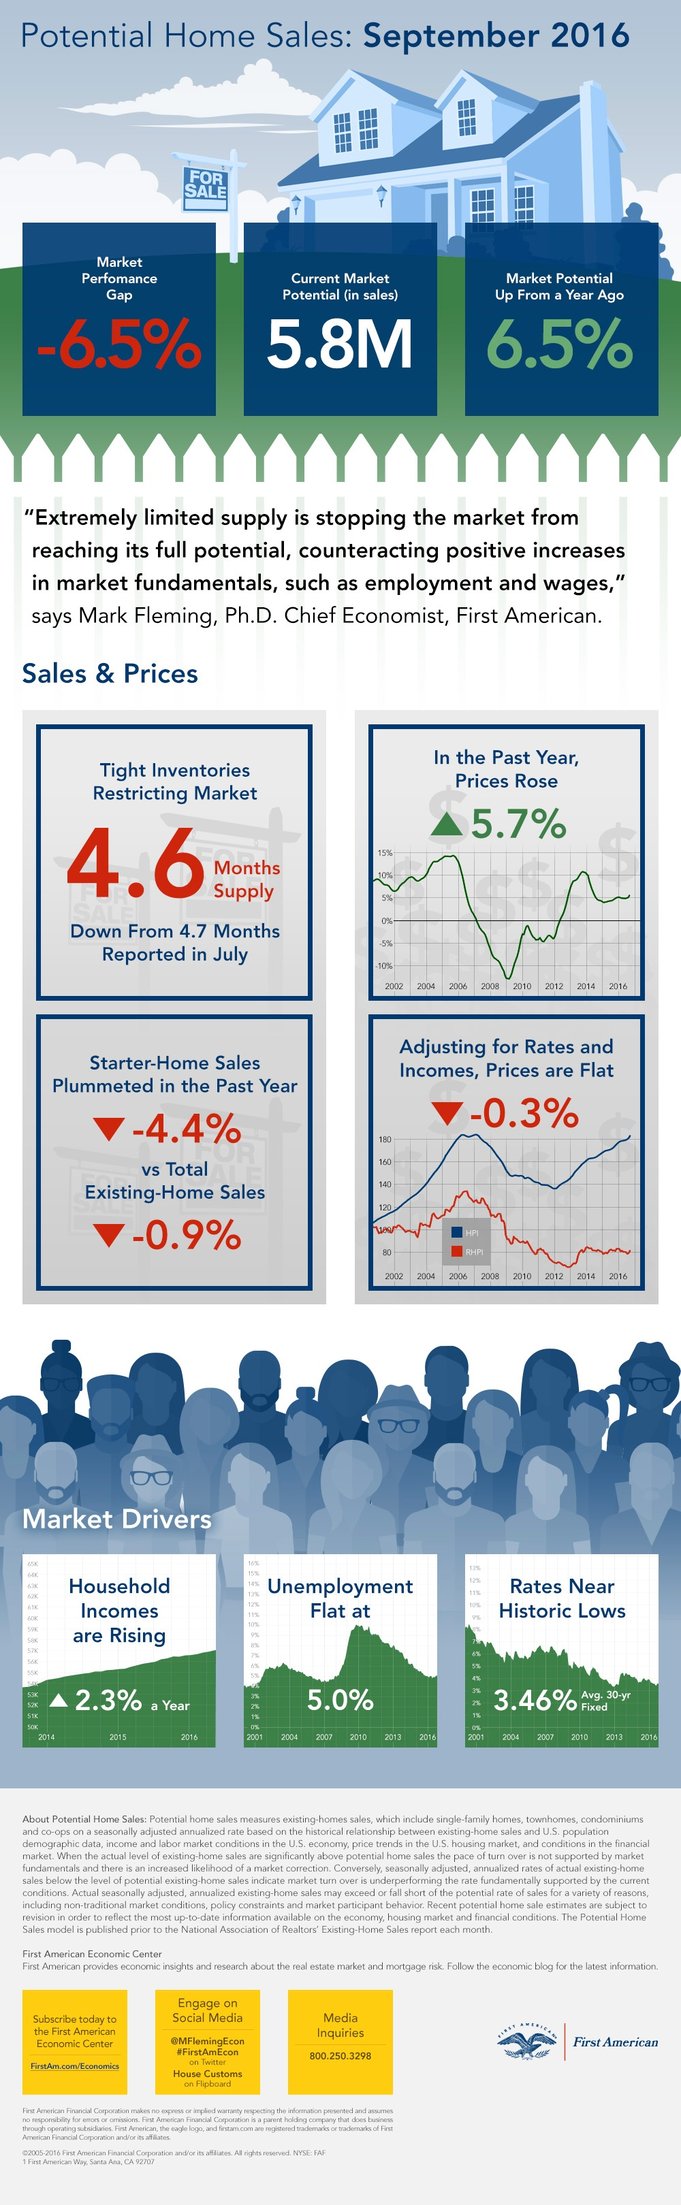
- Potential existing-home sales increased to a 5.8 million seasonally adjusted, annualized rate (SAAR).
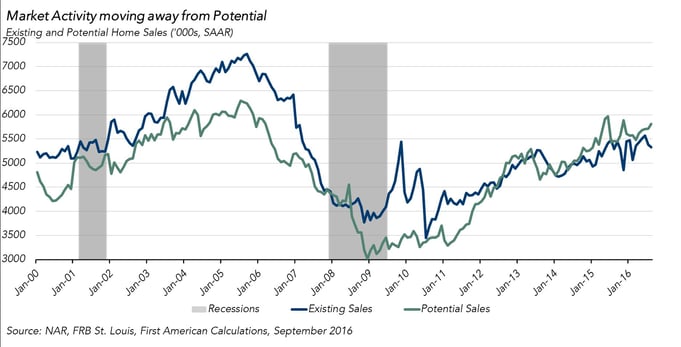
- This represents a 92.6 percent increase from the market potential low point reached in December 2008.
- In September, the market potential for existing-ho
me sales grew by 6.5 percent compared with a year ago, an increase of 352,000 (SAAR) sales. - Currently, potential existing-home sales is 351,000 (SAAR) or 6.0 percent below the pre-recession peak of market potential, which occurred in July 2005.
Market Performance Gap
- The market for existing-home sales is underperforming its potential by 6.5 percent or an estimated 375,000 (SAAR) of sales.
- Last month’s revised performance gap was -6.3 percent or 365,000 (SAAR) sales.
"Extremely limited supply is stopping the market from reaching its full potential, counteracting positive increases in market fundamentals, such as employment and wages."
Low Inventories Restricting Sales and Driving Price Growth, But Buying Power Remains Strong
“Current mortgage rates hovering near historic lows combined with increases in wages remain the key drivers to growth in the housing market, as they continue to soften the impact of rising prices and offer consumers increased leverage and buoyed home-buying power. While this is contributing to greater consumer confidence in the housing market and providing a firm foundation for increased housing demand, tight inventory, particularly in the lower-priced segments, is keeping market activity from reaching its true potential,” said Mark Fleming, chief economist at First American.
Chief Economist Analysis Highlights
- According to the National Association of Realtors, existing-home sales fell 0.9 percent between July and August to 5.33 million (SAAR). The decline in sales was concentrated in starter homes (homes under $100,000), which declined by 4.4 percent year-over-year, while all other home price ranges experienced increases.
- Tight inventories continue to be a drag on the housing market which dropped to a 4.6 months’ supply in August. This put upward pressure on prices which rose 5.7 percent over the past 12 months.
- Incomes continue to trend upward with the Census Bureau reporting that average hourly earnings have increased 2.6 percent in the past year, coinciding with a boost in consumer confidence.
- The unemployment rate ticked upward 0.1 percent between August and September to 5.0 percent, due to an increase in the number of people trying to re-enter the workforce after spending an extended period of time unemployed.
- Mortgage rates ticked up slightly to 3.46 percent, a rise of 0.02 percent between August and September.
What insight does the Potential Home Sales model reveal?
When considering the right time to buy or sell a home, an important factor in the decision should be the market’s overall health, which is largely a function of supply and demand. Knowing how close the market is to a healthy level of activity can help consumers determine if it is a good time to buy or sell, and what might happen to the market in the future. That’s difficult to assess when looking at the number of homes sold at a particular point in time without understanding the health of the market at that time. Historical context is critically important. Our potential home sales model measures what we believe a healthy market level of home sales should be based on the economic, demographic, and housing market environments.
About the Potential Home Sales Model
Potential home sales measures existing-homes sales, which include single-family homes, townhomes, condominiums and co-ops on a seasonally adjusted annualized rate based on the historical relationship between existing-home sales and U.S. population demographic data, income and labor market conditions in the U.S. economy, price trends in the U.S. housing market, and conditions in the financial market. When the actual level of existing-home sales are significantly above potential home sales the pace of turnover is not supported by market fundamentals and there is an increased likelihood of a market correction. Conversely, seasonally adjusted, annualized rates of actual existing-home sales below the level of potential existing-home sales indicate market turnover is underperforming the rate fundamentally supported by the current conditions. Actual seasonally adjusted, annualized existing-home sales may exceed or fall short of the potential rate of sales for a variety of reasons, including non-traditional market conditions, policy constraints and market participant behavior. Recent potential home sale estimates are subject to revision in order to reflect the most up-to-date information available on the economy, housing market and financial conditions. The Potential Home Sales model is published prior to the National Association of Realtors’ Existing-Home Sales report each month.
Infographic for September 2016 Potential Home Sales Model