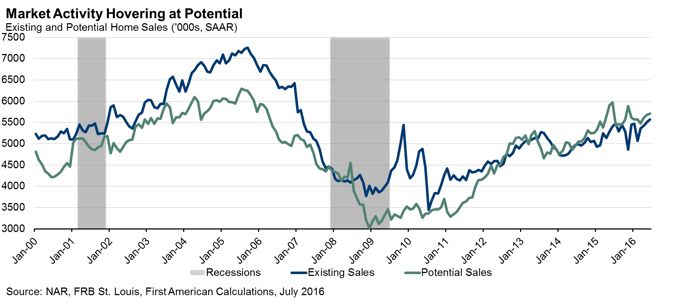
For the month of July, First American’s proprietary Potential Home Sales model showed that the market for existing-home sales is underperforming its potential by 1.3 percent or an estimated 92,000 seasonally adjusted, annualized rate (SAAR) of sales, an improvement over last month’s revised under-performance gap of 1.8 percent, or 104,000 (SAAR) sales. The Potential Home Sales model provides a gauge on whether existing-home sales are under or over their long-run potential level based on current market fundamentals. In July, the market potential for existing-home sales grew by 0.15 percent compared to June, an increase of 8,000 (SAAR) sales, and increased by 5.4 percent compared to a year ago.
This month, potential existing-home sales increased to 5.71 million (SAAR). This represents an 89.9 percent increase from the market potential low point reached in December 2008*, but is down 433,000 (SAAR) or 7.6 percent from the pre-recession peak of market potential, which occurred in July 2005.
Analysis: Low Interest Rates, Jobs Growth and Other Housing “Positives” Keeping Market at Potential
According to the National Association of Realtors (NAR), existing-home sales rose for the third consecutive month in June, with a reported level of 5.57 million (SAAR), up from a downwardly revised 5.51 million (SAAR) sales in May. The 1.1 percent month-over-month increase and the moderating year-over-year increase of 3.1 percent brought existing-home sales to the more normal level of sales that occurred in the early 2000s. The West, which continues to be hampered by tight supply and large price gains, was the only region to experience a year-over-year decline in sales of 0.8 percent. Meanwhile the Midwest, Northeast and South charged ahead with year-over-year increases in sales of 4.7 percent, 5.6 percent and 3.2 percent, respectively.
Low inventories still remain an issue, dropping to a 4.6-month supply, down from the 4.7-month supply seen in April and May, and from the 4.9-month supply of June 2015. The constrained supply in this sellers’ market continues to frustrate potential homebuyers and adds further upward pressure to nominal home prices, which rose an estimated 5 percent year-over-year in May, according to the Case-Shiller House Price Index. While nominal price growth remains strong, prices adjusted for the impact of income and interest rate changes on consumer house-buying power remain historically very low.
"Historically low real house prices, increases in jobs, rising wages, low mortgage rates and greater credit availability are fueling consumer optimism about the housing market."
At the same time, consumers appear to be more optimistic about the housing market. The Fannie Mae Home Purchase Sentiment Index reached a new high in July, up 3.3 points from June to 86.5, with large gains in consumers’ expectations for lower rates and continued house price growth. The survey also showed a growing number of consumers leaning towards purchasing rather than renting if they were to relocate. There was also a notable and similarly positive shift in sentiment amongst younger households. This is coming at a time when credit is slowly becoming more available across the board. The Mortgage Bankers Association (MBA) reported a loosening of credit in July, with their Mortgage Credit Availability Index increasing by 1.0 percent compared to June. While increases were seen in all four of their sub-indices, the Jumbo and Government (FHA/VA/USDA) segments showed particularly strong growth in credit availability with both growing by 1.3 percent month-over-month. The American Enterprise Institute reported similar loosening of lending requirements with their National Mortgage Risk Index, showing greater credit availability in June for first-time and repeat buyers alike.
Mortgage rates have continued to move lower, absorbing the impact of rising prices and giving consumers increased leverage and buoyed house-buying power. The average rate for a 30-year, fixed-rate mortgage fell further in July, dropping to 3.44 percent from 3.57 percent in June. Except for a brief four-month period between October 2012 and January 2013, this marks the lowest mortgage rates have been since Freddie Mac began tracking mortgage rates in 1971. Global economic uncertainty and negative yields on government bonds overseas continue to drive demand for U.S. Treasuries, including the 10-year Treasury note, driving down yields and keeping mortgage rates low for U.S. consumers for the foreseeable future.
The Bureau of Labor Statistics (BLS) put out another strong jobs report showing that employers added 255,000 new jobs to the economy in July, again significantly exceeding the expectation of 180,000 new jobs. Average hourly earnings continued to rise by 2.6 percent year-over-year, and the labor force participation rate increased to 62.8 percent. Historically low real house prices, increases in jobs, rising wages, low mortgage rates and greater credit availability are fueling consumer optimism about the housing market.
About the Potential Home Sales Model
First American’s proprietary Potential Home Sales model provides a gauge on whether existing-homes sales are under or over long-run potential based on current market circumstances. The model’s potential home sales seasonally adjusted annualized rate provides a measure on whether existing-homes sales, which include single-family homes, townhomes, condominiums and co-ops, are outperforming or underperforming based on current market fundamentals. The Potential Home Sales model estimates the historical relationship between existing-home sales and U.S. population demographic data, income and labor market conditions in the U.S. economy, price trends in the U.S. housing market, and conditions in the financial market. For example, seasonally adjusted, annualized rates of actual existing-home sales above the level of potential home sales indicate market turnover is outperforming the rate fundamentally supported by the current conditions. Conversely, seasonally adjusted, annualized rates of actual existing-home sales below the level of potential existing-home sales indicate market turnover is underperforming the rate fundamentally supported by the current conditions. Actual seasonally adjusted, annualized existing-home sales may exceed or fall short of the potential rate of sales for a variety of reasons, including non-traditional market conditions, policy constraints and market participant behavior. Recent potential home sale estimates are subject to revision in order to reflect the most up-to-date information available on the economy, housing market and financial conditions. The Potential Home Sales model will be published prior to the National Association of Realtors’ Existing-Home Sales report each month.


