The housing market exceeded its potential in August 2019, as actual existing-home sales were 0.8 percent above the market’s potential. Housing market potential increased relative to last month, but declined 1.9 percent compared with August of last year. While down compared with a year ago, existing-home sales have slightly outperformed market potential since February 2019, begging the question – how can existing-home sales exceed market potential?
“Rising tenure length means both fewer buyers and fewer homes on the market, and a reduction in the market potential for existing-home sales. You can’t buy what’s not for sale, and you won’t buy, if you don’t sell.”
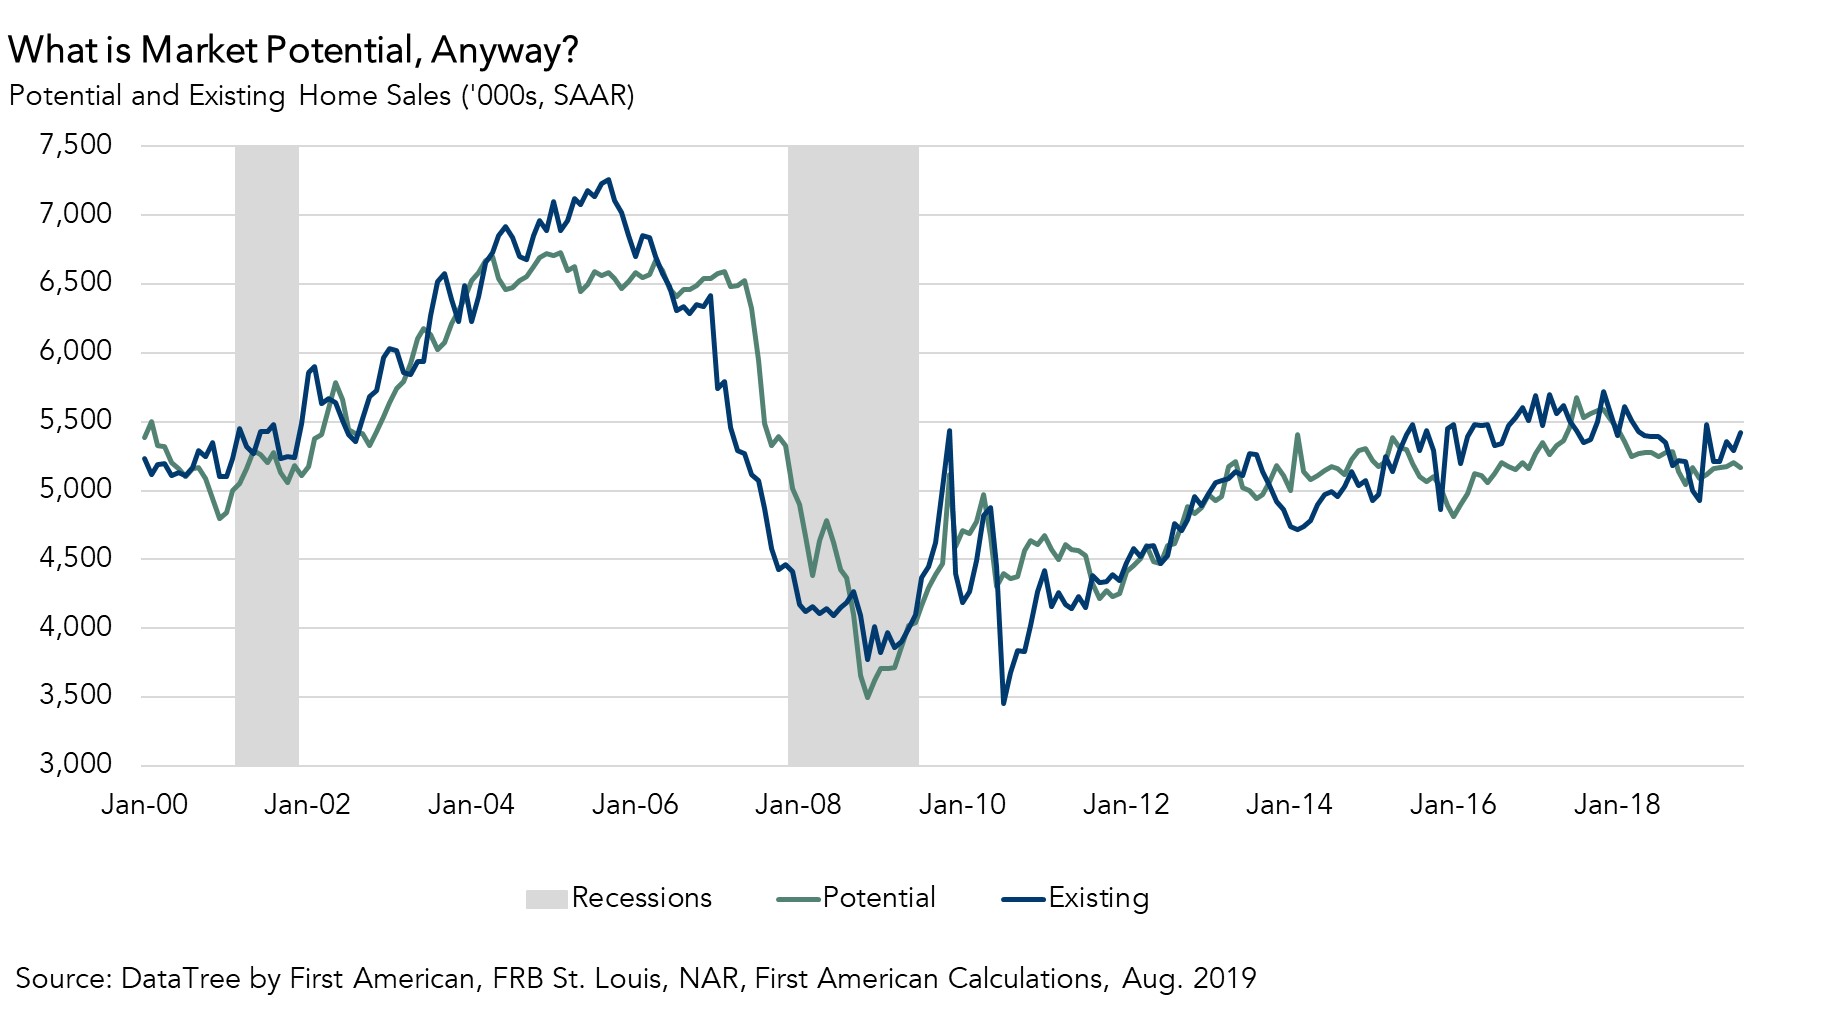
What is Market Potential, Anyway?
Let’s first explain what “potential” means in the scope of economics. Potential gross domestic product (GDP) is the level of production the economy is capable of if its workforce is fully employed and its capital stock is fully utilized. In other words, the total capacity of a nation to produce goods and services. The difference between actual GDP and potential GDP is known as the output gap, which indicates how much the economy is overperforming or underperforming its potential.
The concept behind potential home sales is very similar. Our Potential Home Sales Model measures what a healthy level of home sales should be based on a variety of economic, demographic and housing market metrics. The performance (output) gap indicates how much actual existing-home sales are over or underperforming market potential.
Why are Existing-Home Sales Outperforming Market Potential?
In today’s real economy, real GDP is exceeding its potential, the unemployment rate is outperforming its potential or “natural” rate, and now existing-home sales are outperforming market potential. In other words, given the historical relationship between existing-home sales and population demographic data, homeowner tenure, house-buying power, house price trends and conditions in the financial market, the pace of existing-home sales is exceeding what we believe is fundamentally supported by the market. The main reason? Rising tenure length.
While several forces are working to boost the market potential for existing-home sales, the low supply of homes for sale continues to hold market potential back. Existing-home sales make up approximately 90 percent of all home sales, which means existing homeowners must sell their homes in order for homes to be available for sale. Rising tenure length means both fewer buyers and fewer homes on the market, and a reduction in the market potential for existing-home sales. You can’t buy what’s not for sale, and you won’t buy, if you don’t sell.
Too Soon to Tell
While actual existing-home sales have outperformed market potential for the last six months, the performance gap has been very small. When the actual level of existing-home sales is significantly above the market potential for home sales, the likelihood of a market correction increases.
Today, the performance gap is not at the level that implies a possible market correction. In fact, there are signs that the market potential for existing-homes may begin to rise. The year-over-year growth in tenure length has been slowing since March of this year and it is conceivable that it could stabilize or even decline. Tenure length is largely the result of the rate “lock-in” effect, and seniors aging in place.
In the latest Freddie Mac weekly report of mortgage rates, the 30-year, fixed mortgage rate was 3.5 percent, approaching the lowest mortgage rate in history of 3.3 percent, which occurred in 2012. If mortgage rates remain this low or even fall further, more existing-home owners may be enticed to move as the rate “lock-in” effect fades. While actual existing-home sales are marginally outperforming market potential this month, declining mortgage rates could be the factor that bridges the gap.
August 2019 Potential Home Sales
For the month of August, First American updated its proprietary Potential Home Sales Model to show that:
- Potential existing-home sales increased to a 5.18 million seasonally adjusted annualized rate (SAAR), a 0.2 percent month-over-month increase.
- This represents a 54.2 percent increase from the market potential low point reached in February 1993.
- The market potential for existing-home sales declined by 1.9 percent compared with a year ago, a loss of 102,760 (SAAR) sales.
- Currently, potential existing-home sales is 1.55 million (SAAR), or 23.1 percent below the pre-recession peak of market potential, which occurred in March 2004.
Market Performance Gap
- The market for existing-home sales is marginally overperforming its potential by 0.8 percent or an estimated 41,519 (SAAR) sales.
- The market performance gap increased by an estimated 23,000 (SAAR) sales between July 2019 and August 2019.
First American Deputy Chief Economist Odeta Kushi contributed to this post.
What Insight Does the Potential Home Sales Model Reveal?
When considering the right time to buy or sell a home, an important factor in the decision should be the market’s overall health, which is largely a function of supply and demand. Knowing how close the market is to a healthy level of activity can help consumers determine if it is a good time to buy or sell, and what might happen to the market in the future. That is difficult to assess when looking at the number of homes sold at a particular point in time without understanding the health of the market at that time. Historical context is critically important. Our potential home sales model measures what we believe a healthy market level of home sales should be based on the economic, demographic and housing market environments.
About the Potential Home Sales Model
Potential home sales measures existing-homes sales, which include single-family homes, townhomes, condominiums and co-ops on a seasonally adjusted annualized rate based on the historical relationship between existing-home sales and U.S. population demographic data, homeowner tenure, house-buying power in the U.S. economy, price trends in the U.S. housing market, and conditions in the financial market. When the actual level of existing-home sales are significantly above potential home sales, the pace of turnover is not supported by market fundamentals and there is an increased likelihood of a market correction. Conversely, seasonally adjusted, annualized rates of actual existing-home sales below the level of potential existing-home sales indicate market turnover is underperforming the rate fundamentally supported by the current conditions. Actual seasonally adjusted annualized existing-home sales may exceed or fall short of the potential rate of sales for a variety of reasons, including non-traditional market conditions, policy constraints and market participant behavior. Recent potential home sale estimates are subject to revision to reflect the most up-to-date information available on the economy, housing market and financial conditions. The Potential Home Sales model is published prior to the National Association of Realtors’ Existing-Home Sales report each month.


