Housing market potential strengthened modestly in June, increasing 0.2 percent compared with May, according to our Potential Home Sales Model. Potential home sales are nearly 17 percent higher than the pandemic-driven decline last June.
“Econ 101 tells us that a decline in supply can result in a market with fewer sales and higher prices, which is exactly what’s happening in the housing market today.”
While actual existing-home sales have declined for four months in a row, the market potential for existing-home sales has increased. Potential home sales measures what a healthy level of home sales should be based on current economic, demographic and housing market trends. Comparing housing market potential at different points in time provides insight into how market fundamentals may have changed. In June, for example, the positive market fundamentals driving higher potential home sales offset the negative fundamentals reducing potential home sales on a month-over-month and year-over-year basis. Understanding the shifts in these fundamental forces can help determine whether downward pressure on home sales is due to a demand pullback or a lack of supply. Based on this month’s analysis, actual existing-home sales are moderating primarily due to a lack of supply.
Homebodies Locking Up Housing Supply
The average length of time a homeowner lives in their home reached another historic high in June, according to First American Data & Analytics data, resulting in approximately 11,000 fewer potential home sales. Since existing homeowners supply the majority of the homes for sale and homeowners are living in their homes longer than ever and thus not selling, the housing market faces an ongoing supply shortage.
Before the housing market crash in 2007, the average length of time someone lived in their home was approximately five years. The most recent data shows that the average length of time someone lives in their home reached 10.62 years in June 2021, an historic high. A number of factors are contributing to homeowners staying in their homes longer, including seniors aging in place, some homeowners feeling rate-locked into their homes, and homeowners afraid to sell because there isn’t anything better for them to buy in a limited inventory market. On a year-over-year basis, the length of time homeowners live in their homes increased 3.8 percent, resulting in approximately 160,000 fewer potential home sales. Clearly, a lack of supply is depressing the market potential for existing-home sales.
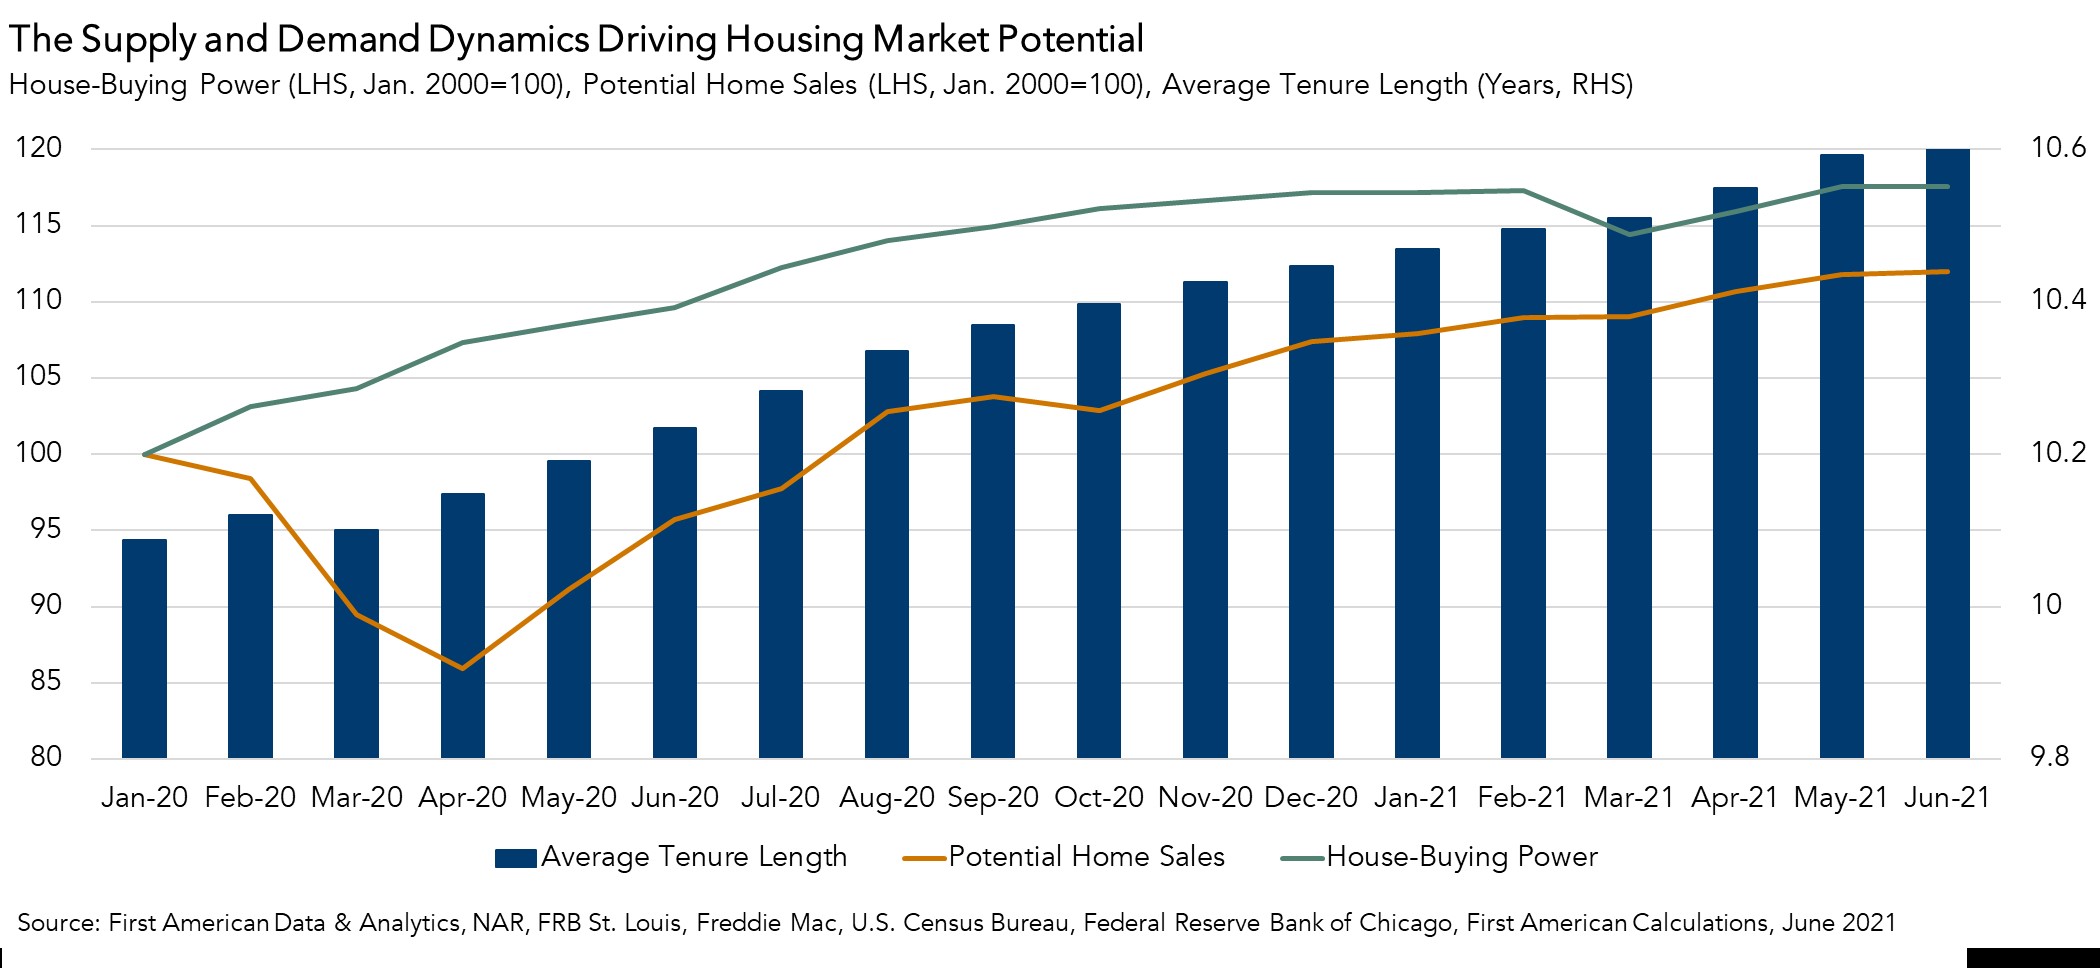
Strong House-Buying Power Still Driving Demand
One of the fundamental drivers of demand is house-buying power, or how much home a potential home buyer can afford to buy given their income and the prevailing 30-year, fixed mortgage rate. On a month-over-month basis in June, house-buying power fell modestly, as income growth was not strong enough to outpace the slight increase in mortgage rates. The decline in house-buying power resulted in 700 fewer potential home sales. On a year-over-year basis, however, the 7.2 percent increase in house-buying power resulted in a gain of approximately 152,000 potential home sales.
What Do the Fundamentals Tell Us About Home Sales?
Existing-home sales have moderated in recent months, and some may believe that this is due to a demand pullback. Yet, examining market dynamics with our Potential Home Sales Model indicates the moderation in home sales is the result of a lack of supply more so than a falling demand. Econ 101 tells us that a decline in supply can result in a market with fewer sales and higher prices, which is exactly what’s happening in the housing market today.
June 2021 Potential Home Sales
For the month of June, First American updated its proprietary Potential Home Sales Model to show that:
- Potential existing-home sales increased to a 6.34 million seasonally adjusted annualized rate (SAAR), a 0.2 percent month-over-month increase.
- This represents an 81.9 percent increase from the market potential low point reached in February 1993.
- The market potential for existing-home sales increased 17.0 percent compared with a year ago, a gain of 922,000 (SAAR) sales. The year-over-year comparison is large this month because economic activity in June of 2020, including the housing market, was significantly curtailed due to the pandemic. Housing rebounded sharply in the summer.
- Currently, potential existing-home sales is 447,354 (SAAR), or 6.6 percent below the pre-recession peak of market potential, which occurred in April 2006.
Market Performance Gap
- The market for existing-home sales outperformed its potential by 5.8 percent or an estimated 366,184 (SAAR) sales.
- The market performance gap increased by an estimated 118,285 (SAAR) sales between May 2021 and June 2021.
First American Deputy Chief Economist Odeta Kushi contributed to this post.
What Insight Does the Potential Home Sales Model Reveal?
When considering the right time to buy or sell a home, an important factor in the decision should be the market’s overall health, which is largely a function of supply and demand. Knowing how close the market is to a healthy level of activity can help consumers determine if it is a good time to buy or sell, and what might happen to the market in the future. That is difficult to assess when looking at the number of homes sold at a particular point in time without understanding the health of the market at that time. Historical context is critically important. Our potential home sales model measures what we believe a healthy market level of home sales should be based on the economic, demographic, and housing market environments.
About the Potential Home Sales Model
Potential home sales measures existing-home sales, which include single-family homes, townhomes, condominiums and co-ops on a seasonally adjusted annualized rate based on the historical relationship between existing-home sales and U.S. population demographic data, homeowner tenure, house-buying power in the U.S. economy, price trends in the U.S. housing market, and conditions in the financial market. When the actual level of existing-home sales are significantly above potential home sales, the pace of turnover is not supported by market fundamentals and there is an increased likelihood of a market correction. Conversely, seasonally adjusted, annualized rates of actual existing-home sales below the level of potential existing-home sales indicate market turnover is underperforming the rate fundamentally supported by the current conditions. Actual seasonally adjusted annualized existing-home sales may exceed or fall short of the potential rate of sales for a variety of reasons, including non-traditional market conditions, policy constraints and market participant behavior. Recent potential home sale estimates are subject to revision to reflect the most up-to-date information available on the economy, housing market and financial conditions. The Potential Home Sales model is published prior to the National Association of Realtors’ Existing-Home Sales report each month.

.jpg)
