While affordability has fallen 48 percent since December 2022, as measured by the Real House Price Index (RHPI), affordability has improved for two straight months. Nominal house price appreciation has slowed dramatically in response to dampened demand. Nationally, annual nominal house price growth peaked in March at 21 percent but has since decelerated by more than 15 percentage points to 5.8 percent in December. In November and December, falling mortgage rates and rising household incomes improved affordability by nearly 6 percent compared with October.
“If mortgage rates fall to 5.7 percent by the end of 2023 as an average of leading industry forecasts suggest, house-buying power would increase by $25,500 compared with December 2022.”
Yet, as discussed in a previous analysis, affordability in the short run will be largely dictated by movements in mortgage rates and any increase in affordability may dissipate as mortgages rates have again drifted higher again in February. However, the average forecast of three leading housing authorities is that the 30-year, fixed mortgage rate will decrease from its December rate of 6.4 percent to 5.7 percent by the end of 2023.
Average Industry Forecasts Expect Rates to Fall by end of 2023, Boosting Affordability
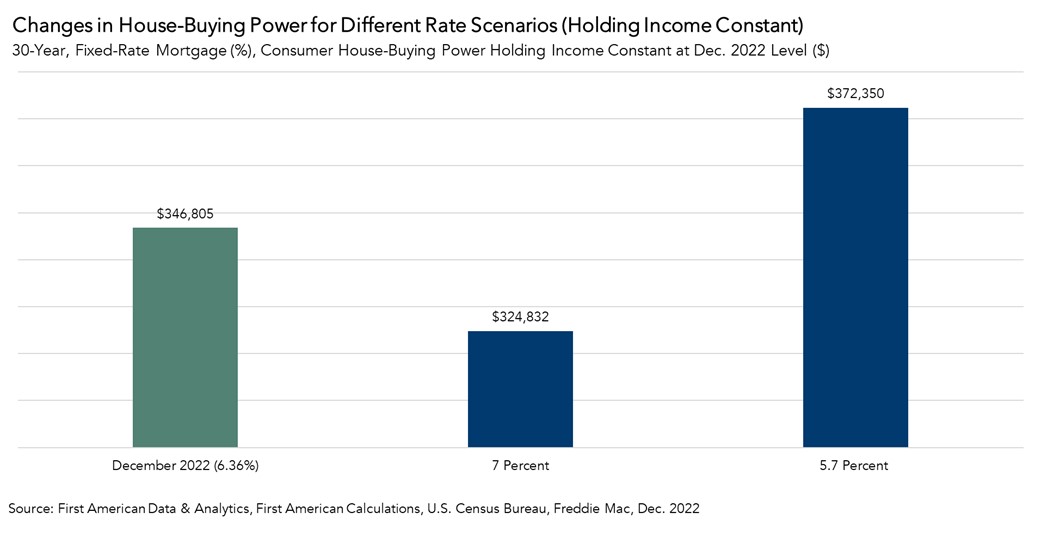
We can use the RHPI to model shifts in mortgage rates and see how they either increase or decrease consumer house-buying power and affordability. When mortgage rates decrease, holding income constant, consumer house-buying power increases and vice versa.
Mortgage rates jumped in early February due to market expectations that inflation will persist, thereby requiring the Federal Reserve to remain restrictive for longer. If rates return to the October peak of approximately 7 percent, assuming a 5 percent down payment and holding average household income constant at the December 2022 level of approximately $74,700, house-buying power would fall by $22,000. If mortgage rates fall to 5.7 percent by the end of 2023 as an average of leading industry forecasts suggest, house-buying power would increase by $25,500 compared with December 2022.
Looking Past the Week-to-Week Volatility in Mortgage Rates
While rates may bounce around on a week-to-week basis as new economic reports shift the outlook for inflation, the industry expectation is that inflation will improve throughout the year. As a result, if rates move lower throughout the year and affordability continues to improve, it could encourage both buyers and sellers to jump back into the market.
For more analysis of affordability, please visit the Real House Price Index. The RHPI is updated monthly with new data. Look for the next edition of the RHPI the week of March 27, 2023.
Sources:
December 2022 Real House Price Index Highlights
The First American Real House Price Index (RHPI) showed that in December 2022:
- Real house prices decreased 4.3 percent between November 2022 and December 2022.
- Real house prices increased 48.3 percent between December 2021 and December 2022.
- Consumer house-buying power, how much one can buy based on changes in income and interest rates, increased 4.9 percent between November 2022 and December 2022, and decreased 28.6 percent year over year.
- Median household income has increased 4.2 percent since December 2021 and 79.6 percent since January 2000.
- Real house prices are 34.2 percent more expensive than in January 2000.
- Unadjusted house prices are now 47.7 percent above the housing boom peak in 2006, while real, house-buying power-adjusted house prices are 6.1 percent above their 2006 housing boom peak.
December 2022 Real House Price State Highlights
- The five states with the greatest year-over-year increase in the RHPI are: Florida (+57.6), Vermont (+57.0 percent), Alabama (+56.8 percent), Maryland (+54.0 percent), and New Hampshire (+53.9 percent).
- There were no states with a year-over-year decrease in the RHPI.
December 2022 Real House Price Local Market Highlights
- Among the Core Based Statistical Areas (CBSAs) tracked by First American, the five markets with the greatest year-over-year increase in the RHPI are: Miami (+67.8 percent), Indianapolis (+66.6 percent), Hartford, Conn. (+57.4 percent), Jacksonville, Fla. (+56.9 percent), and Orlando, Fla. (+56.1 percent).
- Among the Core Based Statistical Areas (CBSAs) tracked by First American, there were no markets with a year-over-year decrease in the RHPI.
About the First American Real House Price Index
The traditional perspective on house prices is fixated on the actual prices and the changes in those prices, which overlooks what matters to potential buyers - their purchasing power, or how much they can afford to buy. First American’s proprietary Real House Price Index (RHPI) adjusts prices for purchasing power by considering how income levels and interest rates influence the amount one can borrow.
The RHPI uses a weighted repeat-sales house price index that measures the price movements of single-family residential properties by time and across geographies, adjusted for the influence of income and interest rate changes on consumer house-buying power. The index is set to equal 100 in January 2000. Changing incomes and interest rates either increase or decrease consumer house-buying power. When incomes rise and mortgage rates fall, consumer house-buying power increases, acting as a deflator of increases in the house price level. For example, if the house price index increases by three percent, but the combination of rising incomes and falling mortgage rates increase consumer buying power over the same period by two percent, then the Real House Price index only increases by 1 percent. The Real House Price Index reflects changes in house prices, but also accounts for changes in consumer house-buying power.
Disclaimer
Opinions, estimates, forecasts and other views contained in this page are those of First American’s Chief Economist, do not necessarily represent the views of First American or its management, should not be construed as indicating First American’s business prospects or expected results, and are subject to change without notice. Although the First American Economics team attempts to provide reliable, useful information, it does not guarantee that the information is accurate, current or suitable for any particular purpose. © 2023 by First American. Information from this page may be used with proper attribution.


