Punxsutawney Phil may have signaled six more weeks of winter, but in housing, it looks like spring (home buying) has already arrived. Typically, the housing market winds down a bit in the winter, but America’s housing market is booming, even in the colder months. The First American Data & Analytics nominal house price index indicates unadjusted home prices nationwide increased by 12.4 percent in December compared with one year ago and are nearly 21 percent above the housing boom peak in 2006. While nominal prices have risen, house-buying power has grown even faster, increasing 21 percent year over year due to historically low rates and still rising incomes for those employed. Even though purchasing power is outpacing price appreciation, the rapid rise in house prices does prompt fears of a repeat of the 2008 crisis, even among some in the housing industry. But last time was different.
“Nationally, house-buying power continues to exceed the median sale price and that implies housing is not overvalued today. Even locally, this time is different.”
The housing market today is not the same as the housing market during the bubble years. Most importantly, today’s housing market is not overvalued. Considering only the nominal level of house prices is not sufficient to determine whether the market is overvalued or not. Lower mortgage interest rates and rising incomes correspond with higher house prices as home buyers can afford to borrow and buy more. If housing is appropriately valued, house-buying power should equal or outpace the median sale price of a home. Looking back at the bubble years, house prices exceeded house-buying power in 2006 nationally, but today house-buying power is nearly twice as high as the median sale price nationally. Of course, real estate is local and not all markets are created equal.
Most Top Markets Are Undervalued…With a Few Exceptions
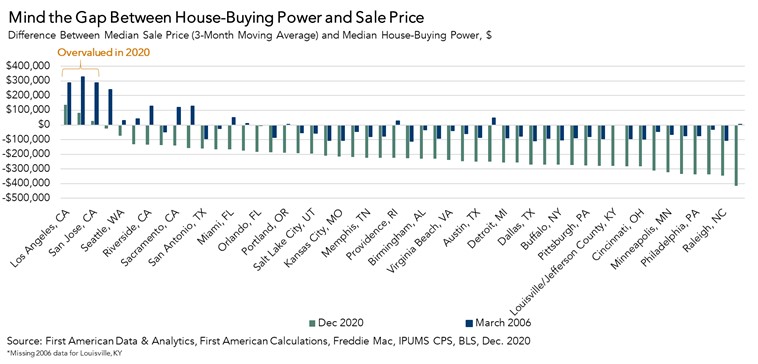
Of the top 50 markets tracked, only three markets, all located in California, were overvalued, meaning the median existing-home sale price exceeded house-buying power, in December. The market with the highest overvaluation was Los Angeles, where the median consumer house-buying power in December was just over $590,000, significantly below the median sale price of a home at approximately $729,000. San Francisco and San Jose were also overvalued, although to a lesser extent. However, all three overvalued markets are still significantly less overvalued than during the national housing boom peak in March 2006. Los Angeles, for example, was overvalued by approximately $286,000 in 2006, more than twice what it is today.
The remaining 47 markets are actually undervalued, many significantly so. In fact, in December 2020, the average percentage difference between house-buying power and the median sale price of an existing home in these 47 markets was nearly 59 percent. In 2006, only 34 markets were considered undervalued, and the average percentage difference between house-buying power and the median sale price of an existing home was 39 percent. Even locally, this time it’s different.
Where Does the Housing Market Go From Here?
The First American Data & Analytics preliminary nominal house price index anticipates continued strengthening of house price appreciation through February. As the housing market heads into the spring home buying season, the ongoing supply and demand imbalance all but assures more house price growth. During the housing bubble, rapid house price appreciation was not entirely supported by economic fundamentals, but in today’s housing market, nominal house price appreciation has been driven by a historic shortage of supply relative to demand and rate-driven surge in house-buying power. Many find it hard to believe, but housing is actually undervalued in most markets and the gap between house-buying power and sale prices indicates there’s room for further house price growth in the months to come.
For more analysis of affordability, please visit the Real House Price Index. The RHPI is updated monthly with new data. Look for the next edition of the RHPI the week of March 29, 2021.
Sources:
December 2020 Real House Price Index Highlights
The First American Real House Price Index (RHPI) showed that in December 2020:
- Real house prices increased 0.5 percent between November 2020 and December 2020.
- Real house prices declined 7.2 percent between December 2019 and December 2020.
- Consumer house-buying power, how much one can buy based on changes in income and interest rates, increased 1.1 percent between November 2020 and December 2020, and increased 21.1 percent year over year.
- Median household income has increased 6.2 percent since December 2019 and 72.9 percent since January 2000.
- Real house prices are 26.3 percent less expensive than in January 2000.
- While unadjusted house prices are now 20.7 percent above the housing boom peak in 2006, real, house-buying power-adjusted house prices remain 48.2 percent below their 2006 housing boom peak.
December 2020 Real House Price State Highlights
- The only state with a year-over-year increase in the RHPI is: Wyoming (+1.1 percent).
- The five states with the greatest year-over-year decrease in the RHPI are: California (-10.4 percent), Louisiana (-10.1 percent), Massachusetts (-9.6 percent), New York (-9.0 percent), and Illinois (-8.2 percent).
December 2020 Real House Price Local Market Highlights
- Among the Core Based Statistical Areas (CBSAs) tracked by First American, the five markets with the greatest year-over-year increase in the RHPI are: Cleveland (+3.0 percent), Memphis, Tenn. (+2.1 percent), Kansas City, Mo. (+1.6 percent), Tampa, Fla. (+1.2 percent), and Hartford, Conn. (+0.6 percent).
- Among the Core Based Statistical Areas (CBSAs) tracked by First American, the five markets with the greatest year-over-year decrease in the RHPI are: San Francisco (-18.6 percent), San Jose, Calif. (-15.5 percent), Boston (-13.7 percent), Miami (-12.6 percent), and San Diego (-11.4 percent).
About the First American Real House Price Index
The traditional perspective on house prices is fixated on the actual prices and the changes in those prices, which overlooks what matters to potential buyers - their purchasing power, or how much they can afford to buy. First American’s proprietary Real House Price Index (RHPI) adjusts prices for purchasing power by considering how income levels and interest rates influence the amount one can borrow.
The RHPI uses a weighted repeat-sales house price index that measures the price movements of single-family residential properties by time and across geographies, adjusted for the influence of income and interest rate changes on consumer house-buying power. The index is set to equal 100 in January 2000. Changing incomes and interest rates either increase or decrease consumer house-buying power. When incomes rise and mortgage rates fall, consumer house-buying power increases, acting as a deflator of increases in the house price level. For example, if the house price index increases by three percent, but the combination of rising incomes and falling mortgage rates increase consumer buying power over the same period by two percent, then the Real House Price index only increases by 1 percent. The Real House Price Index reflects changes in house prices, but also accounts for changes in consumer house-buying power.
Disclaimer
Opinions, estimates, forecasts and other views contained in this page are those of First American’s Chief Economist, do not necessarily represent the views of First American or its management, should not be construed as indicating First American’s business prospects or expected results, and are subject to change without notice. Although the First American Economics team attempts to provide reliable, useful information, it does not guarantee that the information is accurate, current or suitable for any particular purpose. © 2021 by First American. Information from this page may be used with proper attribution.


