Our Potential Home Sales Model, which measures what a healthy market for home sales should be based on the economic, demographic and housing market environments, decreased modestly in June, and remains 2.8 percent lower than one year ago. Mortgage rates have risen substantially since the spring of 2022, and higher rates have a dual impact on sales – pricing out buyers who lose purchasing power and keeping some potential sellers rate-locked in. Since the start of the latest rising mortgage-rate era, existing-home sales have declined by approximately 30 percent. While higher mortgage rates reduce affordability, historically, existing-home sales do not always fall when rates rise. In fact, existing-home sales are often more influenced by why mortgage rates are rising.
“Over the past 50 years, we’ve tracked 12 rising mortgage-rate eras and existing-home sales declined in only half of them.”
Examining Past Rising Mortgage-Rate Eras
Over the past 50 years, we’ve tracked 12 rising mortgage-rate eras and existing-home sales declined in only half of them. The 1977-1981 rising-rate era stands out because mortgage rates increased dramatically from approximately 9 percent to 18.5 percent. During this period, the Federal Reserve hiked interest rates to tame out-of-control inflation. The result was a 43 percent decline in existing-home sales.
The 2005-2006 rising-rate era preceding the 2008 housing crisis also stands out because sales fell dramatically. Rising mortgage rates in that period were driven by the Federal Reserve’s efforts to tame above-target inflation. The Fed’s moves worked, as existing-home sales declined by more than 12 percent in approximately one year. Existing-home sales also decreased in the 1994 rising-rate era, as the Fed increased the federal funds rate to prevent strong economic growth from feeding inflation.
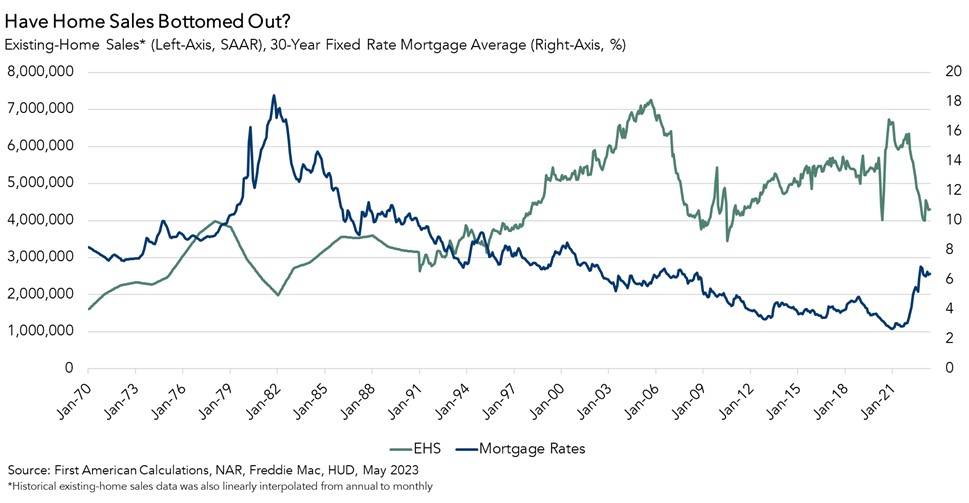
However, there are other examples when existing-home sales have proven resilient to rising-rate environments. For example, mortgage rates spiked in the summer of 2013 when the Fed indicated it would taper its quantitative-easing policy of buying Treasury bonds and mortgage-backed securities. But this ‘taper tantrum’ had little impact on existing-home sales. Most recently, in 2017-2018, it took almost a year of rising mortgage rates, before the pace of existing-home sales declined below the pace seen before rates started to rise.
What’s Going on in Today’s Market?
In the current rising-rate era, mortgage rates have increased by over 3.5 percentage points since the Fall of 2021, while existing-home sales have declined by approximately 30 percent over that same period. This housing market is particularly unique because most homeowners refinanced into rock-bottom, likely never-to-be-seen-again, mortgage rates during the pandemic. More than 90 percent of homeowners in the U.S. have locked in a mortgage rate below 6 percent.
As mortgage rates return to a not-so-new-normal of over 6 percent, those homeowners have a financial disincentive from selling, keeping a lid on the primary source of housing supply, and you can’t buy what’s not for sale. The good news is that home sales have likely already bottomed, and the pace of sales will begin to settle into a new normal below the breakneck pace of 2020 and 2021, but also not as low as earlier this year. The hope is that affordability will improve in the second half of 2023, so that the pace of sales can be not too hot, not too cold, but just right.
June 2023 Potential Home Sales
For the month of June, First American updated its proprietary Potential Home Sales Model to show that:
- Potential existing-home sales decreased to a 5.31 million seasonally adjusted annualized rate (SAAR), a 0.23 percent month-over-month decrease.
- This represents a 52.4 percent increase from the market potential low point reached in February 1993.
- The market potential for existing-home sales decreased 2.8 percent compared with a year ago, a loss of 152,400 (SAAR) sales.
- Currently, potential existing-home sales is 1,478,900 (SAAR), or 21.8 percent, below the peak of market potential, which occurred in April 2006.
First American Deputy Chief Economist Odeta Kushi contributed to this post.
What Insight Does the Potential Home Sales Model Reveal?
When considering the right time to buy or sell a home, an important factor in the decision should be the market’s overall health, which is largely a function of supply and demand. Knowing how close the market is to a healthy level of activity can help consumers determine if it is a good time to buy or sell, and what might happen to the market in the future. That is difficult to assess when looking at the number of homes sold at a particular point in time without understanding the health of the market at that time. Historical context is critically important. Our potential home sales model measures what a healthy market for home sales should be based on the economic, demographic and housing market environments.
About the Potential Home Sales Model
Potential home sales measures existing-home sales, which include single-family homes, townhomes, condominiums and co-ops on a seasonally adjusted annualized rate based on the historical relationship between existing-home sales and U.S. population demographic data, homeowner tenure, house-buying power in the U.S. economy, price trends in the U.S. housing market, and conditions in the financial market. When the actual level of existing-home sales are significantly above potential home sales, the pace of turnover is not supported by market fundamentals and there is an increased likelihood of a market correction. Conversely, seasonally adjusted, annualized rates of actual existing-home sales below the level of potential existing-home sales indicate market turnover is underperforming the rate fundamentally supported by the current conditions. Actual seasonally adjusted annualized existing-home sales may exceed or fall short of the potential rate of sales for a variety of reasons, including non-traditional market conditions, policy constraints and market participant behavior. Recent potential home sale estimates are subject to revision to reflect the most up-to-date information available on the economy, housing market and financial conditions. The Potential Home Sales model is published prior to the National Association of Realtors’ Existing-Home Sales report each month.


