Several indicators now point firmly to a broad cooling in commercial real estate (CRE) markets. The extent of the cooling, however, varies meaningfully by asset class and geography.
“The pending wave of new multifamily units will result in a short-term increase in supply relative to softening demand, which will continue to slow rent and price growth, but it will depend on location, location, location.”
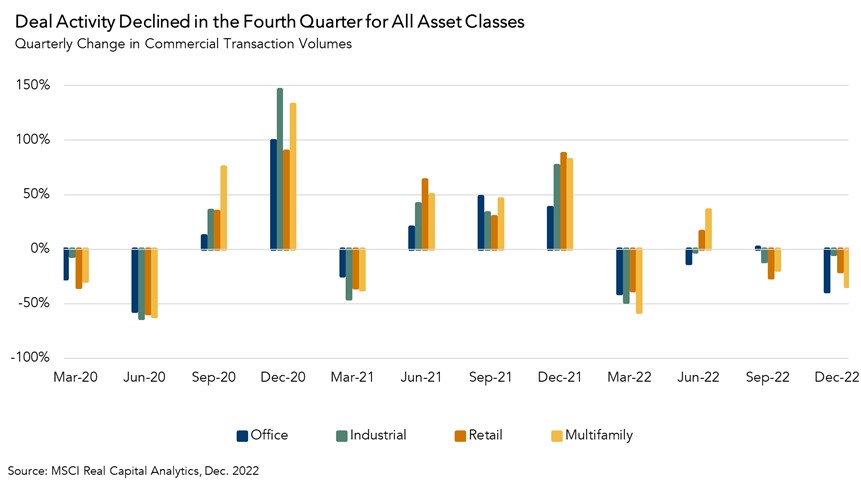
Transaction Volumes Continue to Decline
Commercial transaction volume fell in the fourth quarter by 26 percent on a quarterly basis, making it the second consecutive quarter of declining deal activity. For each asset class shown in the chart below, transaction volumes declined on both an annual and quarterly basis in the fourth quarter, despite the fourth quarter traditionally being a more active quarter for buying and selling.
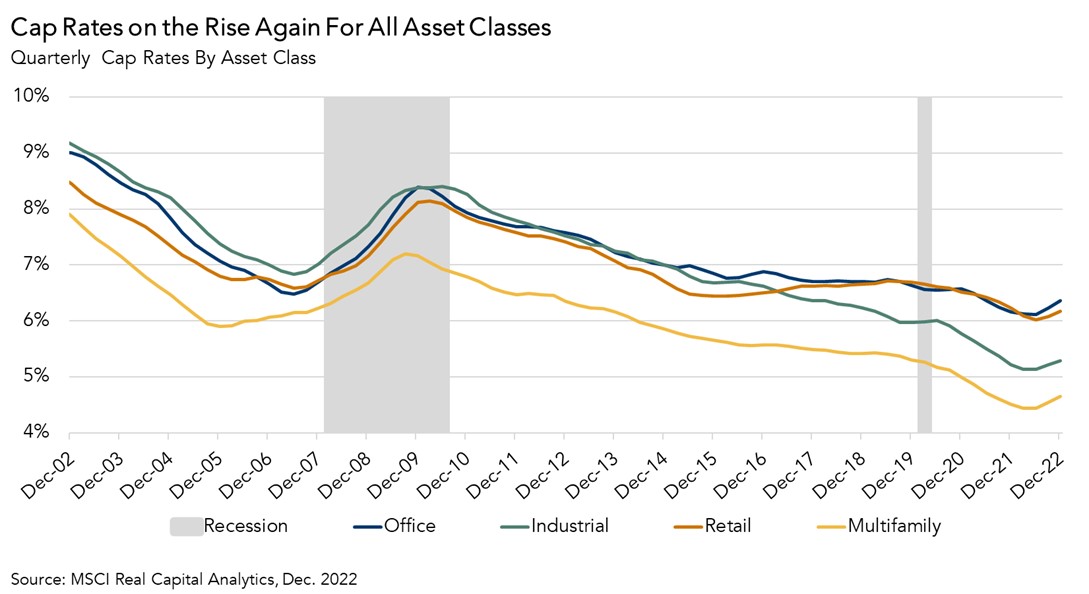
Cap Rate Reversal Has Come
Capitalization (cap) rates for all asset classes are now clearly trending upwards following a long-term downward trend. Though the reversal has so far been modest, traditionally reported cap rates use transaction-based pricing rather than appraisal-based pricing. This means that only buildings that have traded recently are used to calculate these cap rates. Yet, a feature of today’s CRE market is the disconnect in price expectations between buyers and sellers, which has resulted in muted transaction volume. When prices become more broadly agreed upon, cap rates could move quickly as transactions pick back up, increasing the reference points available to both buyers and sellers when valuing a property.
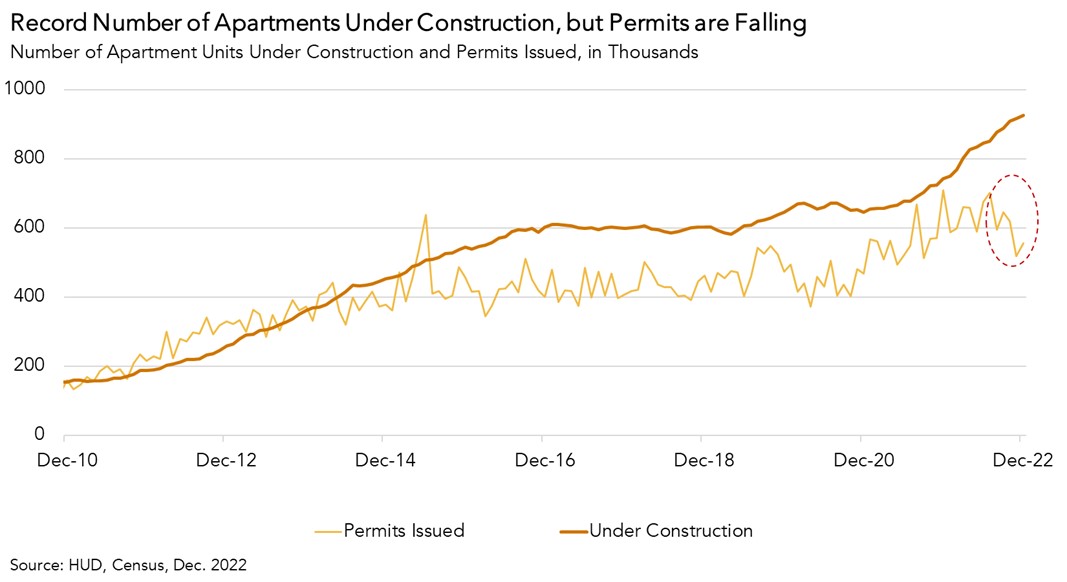
Multifamily Construction at All-Time Highs, but New Construction Shows Signs of Slowing
Nationally, there are a record number of apartment units under construction. As these new units are delivered throughout 2023 and the first half of 2024, rent growth may slow as the market struggles to absorb the new inventory amid softening demand. However, new multifamily permits, a leading indicator of future groundbreaking, declined in the fourth quarter of last year. Should this trend continue, the inventory of under-construction units will fall as builders focus on finishing existing projects rather than starting new ones. The pipeline of supply will eventually adjust downward to meet lower demand.
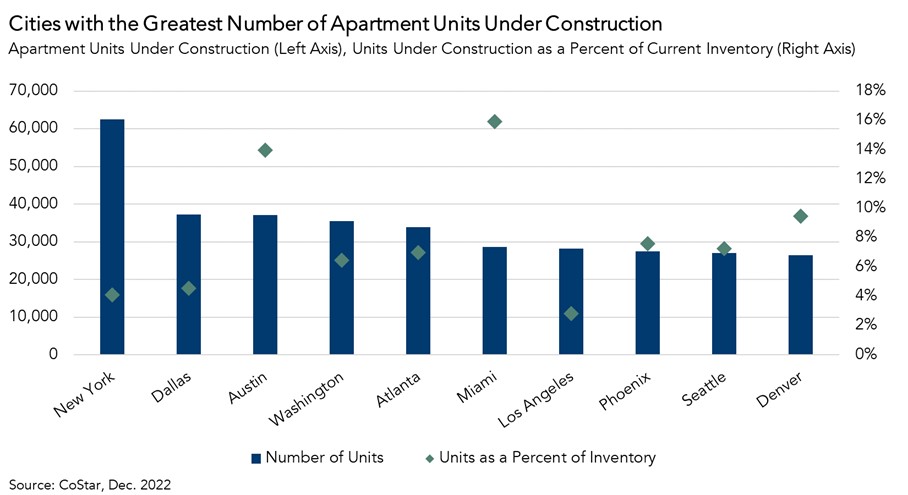
New Apartment Construction Not Distributed Evenly Across Country
Although there are more apartment units under construction now than ever before, that new construction varies meaningfully by city. The 10 cities with the most apartments currently under construction are shown below. While New York City has the most apartment buildings currently being built, that new supply as a share of existing inventory is only about 4 percent. Compare that to Austin and Miami, where new apartment deliveries will account for 14 and 16 percent of existing supply, respectively. This will create significant downward pressure on rents and prices in these two cities.
So, What’s the X-Factor?
Most indicators point to a slowdown in the CRE market. Until buyers and sellers more broadly agree on asset prices, transaction volumes will remain muted. The degree to which transaction volumes remain subdued will vary meaningfully by asset class. The pending wave of new multifamily units will result in a short-term increase in supply relative to softening demand, which will continue to slow rent and price growth, but it will depend on location, location, location.


