Key Points:
- Industrial cap rates fell to record lows in early 2022, then reset higher as interest rates increased and fundamentals normalized.
- The reset in national industrial cap rates is largely complete, signaling the market has shifted from re-pricing to fine-tuning.
- First American’s Industrial Potential Cap Rate Model suggests industrial fundamentals support observed cap rates.
The wild ride for industrial cap rates[1] appears to be over. During the pandemic, eCommerce sales surged and supply chains were disrupted, driving strong demand for warehouse and logistics space. With limited availability, industrial vacancy rates fell to historic lows and investors bid aggressively for scarce assets, pushing cap rates to an all-time low in early 2022. Buyers accepted lower income at acquisition, betting that rents and prices would continue rising rapidly.
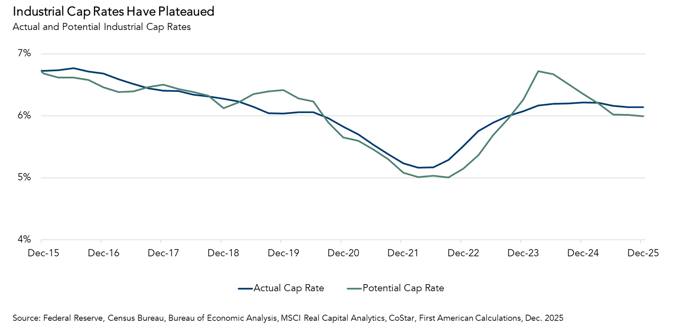
For many, that bet paid off. Industrial price and rent growth proved more resilient than in other asset classes in the post-pandemic period, but that outperformance triggered a supply response. Construction surged to an all-time high in the third quarter of 2022, lifting vacancy to higher – though not alarming – levels. Meanwhile, eCommerce sales returned to their pre-pandemic growth trend. Combined with sharply higher interest rates, those dynamics pushed industrial cap rates up from 5.2 percent in the first half of 2022 to 6.2 percent in the first quarter of 2024- an implied 16 percent valuation decline, holding net operating income constant. Since then, industrial cap rates have remained about the same.
“Since early 2024, industrial cap rates have plateaued, and the Industrial PCR Model reinforces the view that market fundamentals are well-balanced and broadly supportive of prevailing levels.”
A Potential Industrial Cap Rate Plateau
So, an important question facing industrial real estate market is, will the plateau that industrial cap rates reached in 2024 continue or can we expect some volatility to return?
One way to evaluate that question is with First American’s Industrial Potential Cap Rate (PCR) Model, which estimates a market-supported “potential” industrial cap rate based on key drivers, such as vacancy (leasing demand), construction starts (future supply), and eCommerce sales as a percent of total retail sales (a long-term demand driver for industrial space).
The industrial PCR is currently 6 percent, slightly below the observed 6.2 percent, suggesting fundamentals support marginally lower cap rates. Moreover, there has been little movement in the model’s underlying drivers for two consecutive quarters, indicating that industrial fundamentals are largely balanced. This alignment was driven by stabilizing vacancy rates, falling industrial construction starts, and eCommerce sales as a percent of total retail sales returning to its pre-pandemic trendline.
Where are Industrial Cap Rates Headed in 2026?
Industrial cap rates appear to have reached a stable plateau. After falling to historic lows during the post-pandemic boom, cap rates reset higher as interest rates increased and the market shifted from exuberance to price discovery. Since early 2024, cap rates have plateaued, and the Industrial PCR Model reinforces the view that market fundamentals are well-balanced and broadly supportive of prevailing levels. If the leasing market continues absorbing new supply without a meaningful deterioration in demand, industrial cap rates are likely to remain on this plateau – or perhaps begin to roll only modestly downhill – for the foreseeable future.
Fourth Quarter 2025 Industrial Potential Cap Rate Model
-
The industrial PCR was 6.0 percent, the same as in the third quarter of 2025.
-
The industrial PCR decreased by 0.4 percentage points as compared with one year ago.
Industrial Cap Rate Outlook Gap
The gap between the actual industrial cap rate and the industrial PCR provides insight into the likelihood of shifts in the actual cap rate. If the industrial PCR is below the actual industrial cap rate, it indicates that fundamentals supported lower cap rates than were observed. If the industrial PCR is above the actual industrial cap rate, it indicates that fundamentals supported higher cap rates than were observed.
- In the fourth quarter of 2025, the actual national industrial cap rate of 6.2 percent was 0.2 percentage points higher than the industrial PCR, indicating that market fundamentals supported slightly lower cap rates than were observed.
- The gap between the industrial PCR and the actual industrial cap rate remained the same in the fourth quarter as compared with the third quarter of 2025, at 0.1 percentage point.
[1] A capitalization, or “cap”, rate is one measure of return on investment provided by a building and is equal to the net operating income (“NOI”) generated by the building divided by the price of the building. For example, an industrial property purchased for $100,000 that generates income of $10,000 a year has a cap rate of 10 percent.


