Affordability sank to its lowest level since 2008 in October, as two of the three key drivers of the Real House Price Index (RHPI) swung in favor of reduced affordability relative to one year ago. Higher mortgage rates and record year-over-year nominal house price growth triggered a nearly 20 percent jump in the RHPI (rising RHPI values indicate declining affordability). The soaring nominal house prices and uptick in mortgage rates swamped any affordability gains from the 3.6 percent yearly increase in household income. Since we know real estate is local, house-buying power and nominal house price gains vary by city, begging the question, where is affordability declining the most?
“The challenge for home buyers in 2022 will mirror 2020 and 2021 – you can’t buy what’s not for sale, even if you can afford to.”
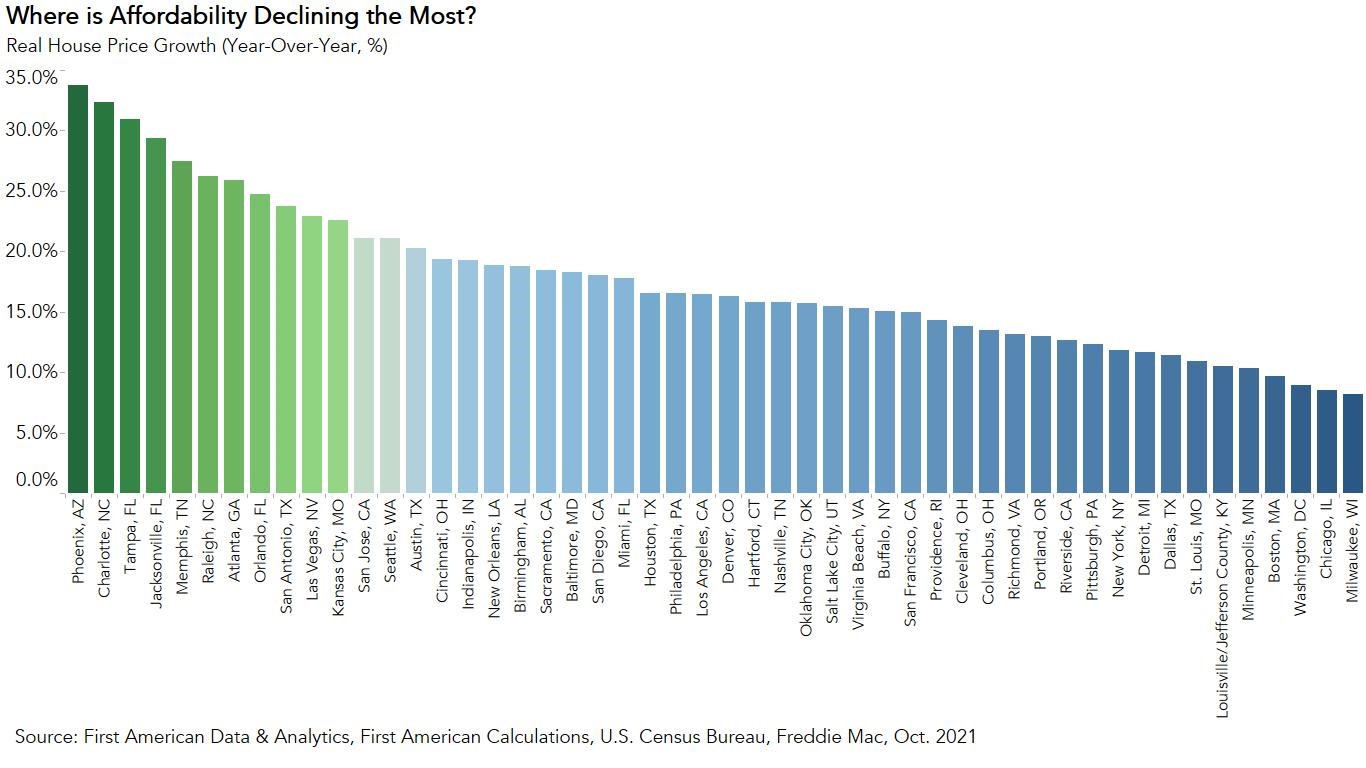
The Five Cities Where Affordability Declined the Most
Affordability declined year over year in all of the markets we track. The five markets with the greatest year-over-year decline in affordability were:
1.) Phoenix (+33.7 percent),
2.) Charlotte, N.C. (+32.3 percent),
3.) Tampa, Fla. (+30.9 percent),
4.) Jacksonville, Fla. (+29.3 percent),
5.) Memphis, Tenn. (+27.5 percent).
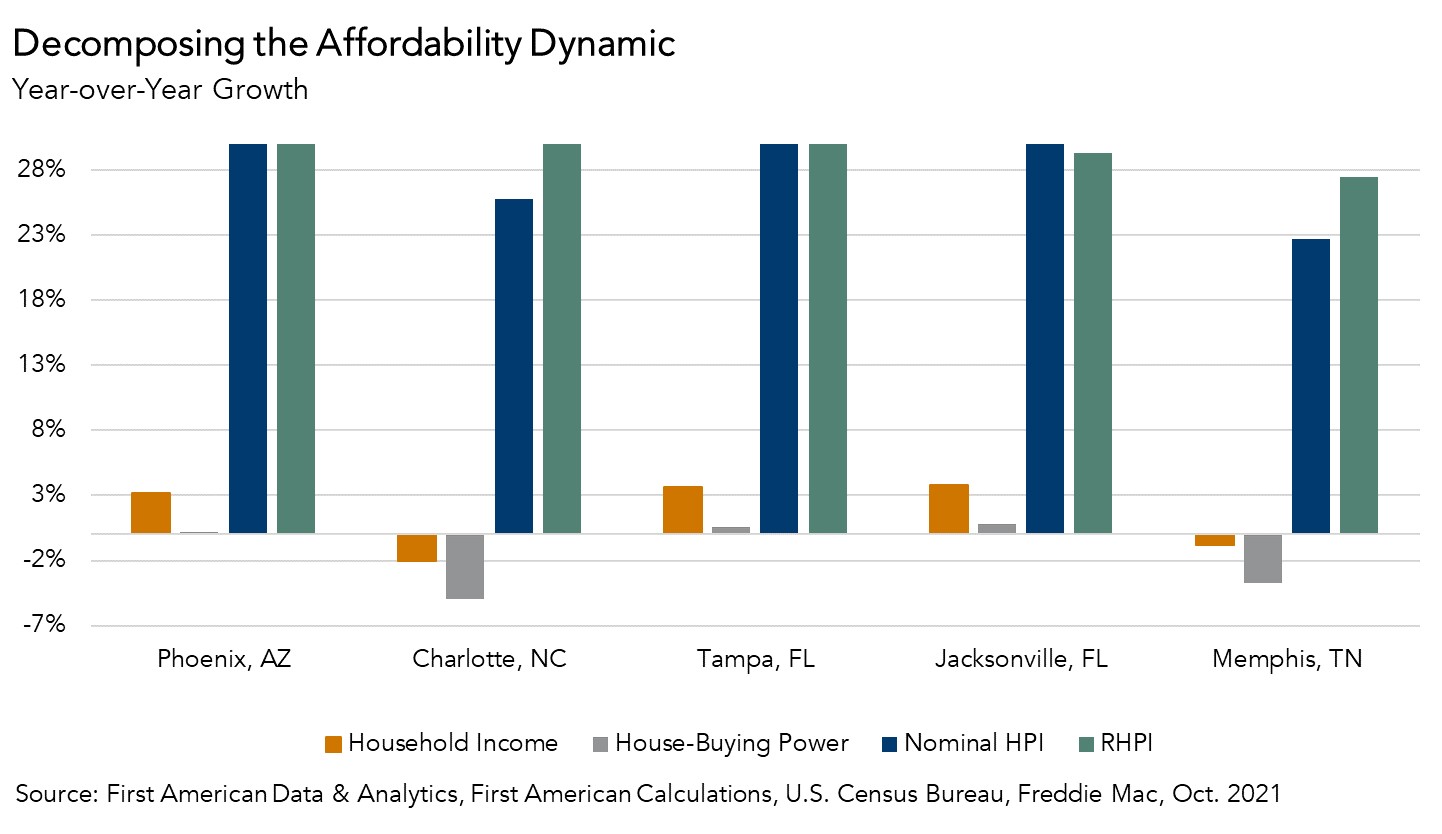
In October, mortgage rates increased 0.2 percentage points relative to one year ago, which reduces affordability, all else held equal. Higher mortgage rates decrease affordability equally in each market as mortgage rates are generally similar across the country. However, household income growth and nominal house prices vary by market, creating the market-level variance in affordability. Faster nominal house price appreciation can erode, or even eliminate, the boost in affordability from higher household income.
Phoenix suffered the greatest year-over-year loss in affordability in October, mostly due to the nearly 34 percent annual increase in nominal house price growth. Robust investor activity and strong net-in migration to Phoenix has fueled soaring demand for homes against a limited supply of homes for sale. In Charlotte, N.C., household income declined modestly, meaning all three key drivers of the RHPI dragged affordability down in October relative to one year ago. The importance of household income becomes apparent when comparing the decline in affordability in Charlotte to Tampa. While annual nominal house price appreciation in Tampa outpaced that of Charlotte, rising household income tempered the decline in affordability. Ultimately, nominal house price appreciation overwhelmed any affordability lift from house-buying power in all three of these markets.
How Will Affordability Impact the Housing Market in 2022?
If affordability falls too far, some home buyers on the margin will pull back, prompting fewer bidding wars and causing house prices to moderate. In the near term, a labor market characterized by high demand, but limited supply means upward pressure on wages as employers compete to attract employees. While mortgage rates are expected to increase in 2022 as the economic recovery continues, consensus expectations still put them below 4 percent. For some home buyers, as the ‘big short’ in housing supply continues, it will become impossible to keep up with double-digit nominal house price growth, especially in a rising-rate environment. The challenge for home buyers in 2022 will mirror 2020 and 2021 – you can’t buy what’s not for sale even if you can afford to.
For more analysis of affordability, please visit the Real House Price Index. The RHPI is updated monthly with new data. Look for the next edition of the RHPI the week of January 24, 2022.
Sources:
October 2021 Real House Price Index Highlights
The First American Real House Price Index (RHPI) showed that in October 2021:
- Real house prices increased 3.7 percent between September 2021 and October 2021.
- Real house prices increased 19.6 percent between October 2020 and October 2021.
- Consumer house-buying power, how much one can buy based on changes in income and interest rates, decreased 1.7 percent between September 2021 and October 2021, and increased 0.6 percent year over year.
- Median household income has increased 3.6 percent since October 2020 and 66.9 percent since January 2000.
- Real house prices are 7.0 percent less expensive than in January 2000.
- While unadjusted house prices are now 39.7 percent above the housing boom peak in 2006, real, house-buying power-adjusted house prices remain 34.7 percent below their 2006 housing boom peak.
October 2021 Real House Price State Highlights
- The five states with the greatest year-over-year increase in the RHPI are: Arizona (+32.7 percent), Florida (+25.9), South Carolina (+25.9 percent), Georgia (+24.8 percent), and Nevada (+23.7),
- There were no states with a year-over-year decrease in the RHPI.
October 2021 Real House Price Local Market Highlights
- Among the Core Based Statistical Areas (CBSAs) tracked by First American, the five markets with the greatest year-over-year increase in the RHPI are: Phoenix (+33.7 percent), Charlotte, N.C. (+32. 3), Tampa, Fla. (+30.9 percent), Jacksonville, Fla. (+29.3 percent), and Memphis, Tenn. (+27.5 percent).
- Among the Core Based Statistical Areas (CBSAs) tracked by First American, there were no markets with a year-over-year decrease in the RHPI.
About the First American Real House Price Index
The traditional perspective on house prices is fixated on the actual prices and the changes in those prices, which overlooks what matters to potential buyers - their purchasing power, or how much they can afford to buy. First American’s proprietary Real House Price Index (RHPI) adjusts prices for purchasing power by considering how income levels and interest rates influence the amount one can borrow.
The RHPI uses a weighted repeat-sales house price index that measures the price movements of single-family residential properties by time and across geographies, adjusted for the influence of income and interest rate changes on consumer house-buying power. The index is set to equal 100 in January 2000. Changing incomes and interest rates either increase or decrease consumer house-buying power. When incomes rise and mortgage rates fall, consumer house-buying power increases, acting as a deflator of increases in the house price level. For example, if the house price index increases by three percent, but the combination of rising incomes and falling mortgage rates increase consumer buying power over the same period by two percent, then the Real House Price index only increases by 1 percent. The Real House Price Index reflects changes in house prices, but also accounts for changes in consumer house-buying power.
Disclaimer
Opinions, estimates, forecasts and other views contained in this page are those of First American’s Chief Economist, do not necessarily represent the views of First American or its management, should not be construed as indicating First American’s business prospects or expected results, and are subject to change without notice. Although the First American Economics team attempts to provide reliable, useful information, it does not guarantee that the information is accurate, current or suitable for any particular purpose. © 2021 by First American. Information from this page may be used with proper attribution.


