The last three and a half years have been a whipsaw of a ride for the multifamily market. Following the surge in leasing demand during the pandemic, demand to own apartment buildings boomed, which drove transaction volume to record highs. Shortly thereafter, the Federal Reserve began raising interest rates to combat inflation that turned out not to be transitory. Higher interest rates limited what multifamily buyers could afford to borrow and, therefore, what they could pay for properties. At the same time, sellers of multifamily properties remained anchored to the very high prices of late 2021 and early 2022, which made property valuations difficult to ascertain.
The resulting gap in price expectations that opened between buyers and sellers drove multifamily transaction volume down to levels that, outside of the very early days of the COVID-19 pandemic, have not been observed since the aftermath of the Global Financial Crisis (GFC) of 2008-2009. As a result of this decline in demand to own apartment properties, multifamily capitalization (“cap”) rates have been increasing for roughly the last two years.
Yet, all down cycles end, and there are now reasons to be cautiously optimistic that we are nearing peak multifamily cap rates.
“All down cycles end, and there are now reasons to be cautiously optimistic that we are nearing peak multifamily cap rates.”
The Link Between Transaction Volume and Cap Rates
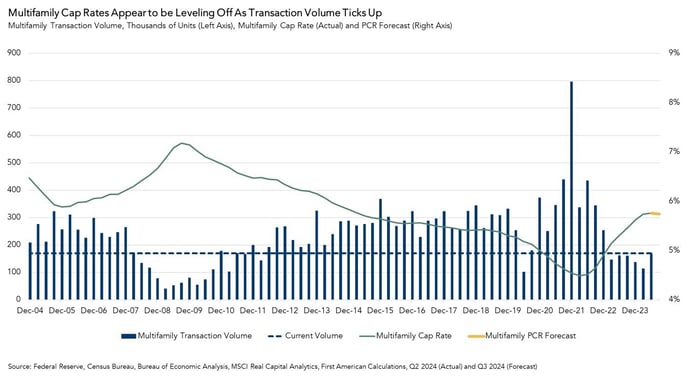
As we’ve described in a prior post, First American’s Multifamily Potential Cap Rate (PCR) Model indicates that transaction volume is one of the main drivers of multifamily cap rates. Transaction volume is a measure of demand to purchase apartment properties, and a cap rate[1] is a measure of yield that reflects what buyers are willing to pay to acquire an income stream generated by a commercial property. In an environment of limited demand, cap rates need to rise to attract more buyers back into the market.
Since early 2022 multifamily cap rates have increased by 125 basis points from a low of 4.5 percent in the first quarter of 2022 to 5.75 percent in the second quarter of 2024, which corresponds to a decline in value of approximately 22 percent. This has created a challenging environment for multifamily operators that had previously benefited from the steady tailwind of persistently declining cap rates since the end of 2009.
Now, though, it appears that we may have reached a bottom in the market in terms of transaction activity. In the second quarter of 2024, nearly 170,000 apartment units worth $39 billion were purchased, the most since the fourth quarter of 2022. This reflects an increase of traded space of nearly 50 percent compared to the first quarter of 2024 and 20 percent compared to the second quarter of 2023.
Multifamily Cap Rates May be at or Near Peak
This increase in volume in the second quarter is an indication that multifamily cap rates are, at this point, high enough to attract more buyers. While transaction volume is still low relative to 2021 and pre-pandemic levels, buyers are now stepping back into the market and taking on risk if they can find a property, or portfolio of properties, at the right price.
Based on second quarter multifamily transaction volume, the multifamily PCR model predicts that multifamily cap rates should decline slightly in the third quarter to 5.7 percent from 5.8 percent today. While not a huge drop, it would be the first such decline since the first quarter of 2022.
Big Buy Caveat
While increasing transaction volume in the second quarter is a positive sign, there is a caveat worth bearing in mind. Blackstone’s acquisition of AIR communities accounted for $10 billion of the $39 billion worth of apartment properties purchased in the second quarter. Excluding that single large transaction, volume would have declined by approximately 11 percent on a year-over-year basis, rather than the increase of 20 percent that did materialize. Even so, an 11 percent decline represents a meaningful deceleration from the 68 percent annual decline that occurred in the second quarter of 2023 when compared to the second quarter of 2022.
Although the spike in transaction volume is in large part due to a single significant transaction, it’s important to recognize that this transaction did occur. A $10 billion deal represents substantial movement in the market. The increased activity from large buyers at current cap rates suggests that we may be approaching the bottom of the multifamily down cycle and nearing peak cap rates.
Second Quarter 2024 Multifamily Potential Cap Rate Model
- The multifamily PCR was 5.3 percent, an increase of 0.1 percentage point as compared with the first quarter of 2024.
- The multifamily PCR increased by 0.4 percentage points as compared with one year ago.
Multifamily Cap Rate Outlook Gap
- The actual multifamily cap rate was 0.4 percentage points higher than the multifamily PCR, which suggests that market fundamentals in the second quarter supported lower multifamily cap rates than were observed.
- The gap between the actual multifamily cap rate and the multifamily PCR decreased by 0.1 percentage points in the second quarter of 2024 as compared to the first quarter of 2024.
About the Multifamily Potential Cap Rate Model
The multifamily Potential Cap Rate (PCR) Model estimates cap rates based on the historical relationship between multifamily transaction volume, annual changes in renter household formation, and multifamily mortgage flows. The multifamily PCR Model uses these metrics to establish a potential cap rate level that is supported by these market fundamentals. When actual multifamily cap rates are significantly above the multifamily PCR, it indicates that market fundamentals supported lower cap rates than were observed. Conversely, when actual cap rates are significantly below the potential cap rate level, market fundamentals supported higher cap rates than were observed. Multifamily cap rates are aggregated nationally, and the PCR Model is updated quarterly.
[1] A cap rate is one measure of estimated yield, or return, on investment provided by a building and is equal to the net operating income (“NOI”) generated by the building divided by the price of the building. For example, a property purchased for $100,000 that generates income of $10,000 a year has a cap rate of 10 percent. All else held equal, higher cap rates represent higher rates of return on income and lower valuations. Since cap rates do not take debt service into consideration, cap rates are a measure of what is called unlevered yield.
Second Quarter 2024 Industrial Potential Cap Rate Model
First American’s Industrial PCR Model estimates a potential national cap rate for industrial properties based on several industrial property market fundamentals, including industrial vacancy rates, eCommerce sales, construction starts and commercial mortgage flows.
- The industrial PCR was 6.8 percent, an increase of 0.1 percentage points as compared with the first quarter of 2024.
- The industrial PCR increased by 1.1 percentage points as compared with one year ago.
Industrial Cap Rate Outlook Gap
The gap between the actual industrial cap rate and the industrial PCR provides insight into the likelihood of shifts in the actual cap rate. If the industrial PCR is below the actual industrial cap rate, it indicates that fundamentals supported lower cap rates than were observed. If the industrial PCR is above the actual industrial cap rate, it indicates that fundamentals supported higher cap rates than were observed.
- In the second quarter of 2024, the actual national industrial cap rate of 6.4 percent was 0.4 percentage points lower than the industrial PCR, indicating that market fundamentals supported a higher industrial cap rate than was observed.
- The gap between the industrial PCR and the actual industrial cap rate remained the same in the second quarter as compared with the first quarter of 2024.
Second Quarter 2024 All-Asset Potential Cap Rate Model
First American’s All-Asset PCR Model estimates a potential national cap rate for all asset classes based on several CRE market fundamentals, including rental income, prevailing occupancy rates, interest rates, the amount of commercial mortgage debt in the economy, and recent property price trends.
- The all-asset PCR was 5.9 percent, the same as in the first quarter of 2024.
- The all-asset PCR decreased by 0.1 percentage points as compared with one year ago.
All-Asset Cap Rate Outlook Gap
- The actual all-asset cap rate was 0.4 percentage points higher than the PCR, which suggests that market fundamentals in the second quarter supported lower actual cap rates than were observed. This gap was unchanged compared with the first quarter of 2024.


