Over the last two years, commercial real estate (CRE) transaction volume has declined precipitously as interest rates soared. Currently, the market is at a multi-year trough in transaction activity, and many are wondering when it may pick back up. Though it’s hard to say with certainty, one factor that will invariably play a role in the recovery of the CRE market is the quantity of CRE mortgages coming due this year and next.
In this X-Factor, we’ll look at the quantity and pace of those maturities, how much is coming due, who owns the debt, and how these maturities will impact the timing of any recovery in transaction volume.
“Since so much debt matures this year, and since distressed debt workouts take time to resolve, the full downward impact of this year’s debt maturities on property prices and transaction volume will not be felt until the first or second quarter of 2025.”
CRE Transaction Volume Remains Slow, Regardless of How You Measure It
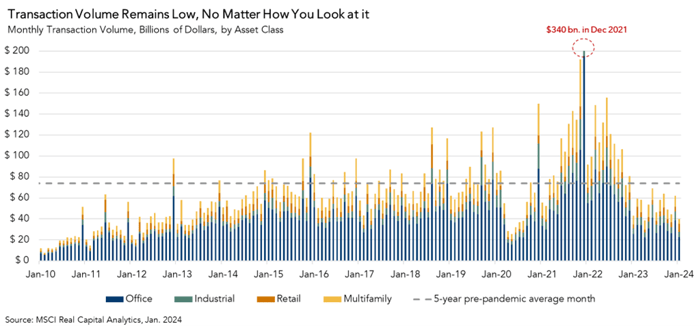
Given the record levels of CRE transaction volume observed in late 2021 and early 2022, you would think that year-over-year comparisons of 2023 to 2022 could obscure the latest trend of declining volume. After all, the low interest-rate environment that immediately followed the global pandemic drove CRE transaction volume to all-time highs, so clearly some decline from that anomalous peak was inevitable.
Yet the decline in volume looks somewhat similar regardless of whether you use a year-over-year comparison or compare to pre-pandemic trends. All told, transaction volume in 2023 declined by approximately 51 percent compared to 2022. If you instead compare the most recent transaction activity to pre-pandemic levels, the story changes very little. In January 2024, transaction volume of $40 billion was down by 46% compared to the pre-pandemic monthly average of $74 billion (from 2015-2019).
Wall of Mortgage Maturities Suggest Prices Have Further to Fall
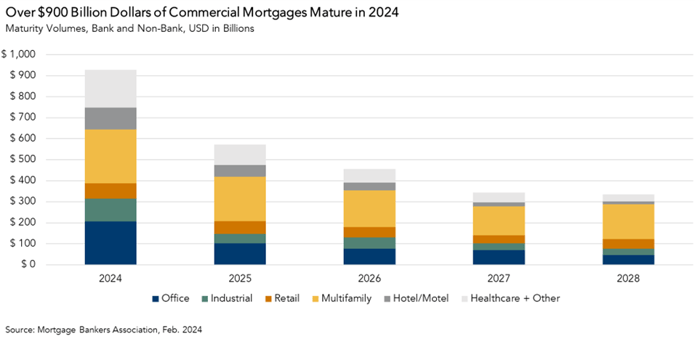
In 2024 alone, approximately $930 billion in CRE mortgages will come due. For those CRE owners whose mortgages are coming due, the option to wait and see – and hope for a rate cut in the future – will soon run out. In scenarios like these, sellers may be forced to market by pressures outside of their control. No seller wants to be a forced seller, of course, but plenty of buyers are actively looking for these forced-sale scenarios.
However, not all maturing mortgages will come to market all at once. In some cases, lenders are willing to work with borrowers if they can continue to pay the mortgage. Even if a foreclosure occurs, returning the property to market does not happen overnight. Though we are clearly seeing price discovery now, the delayed nature of foreclosure implies that additional price discovery will continue into next year and will be a gradual, rather than a sudden, process as these loans come due.
How Many of These Maturing Loans Might Run into Trouble?
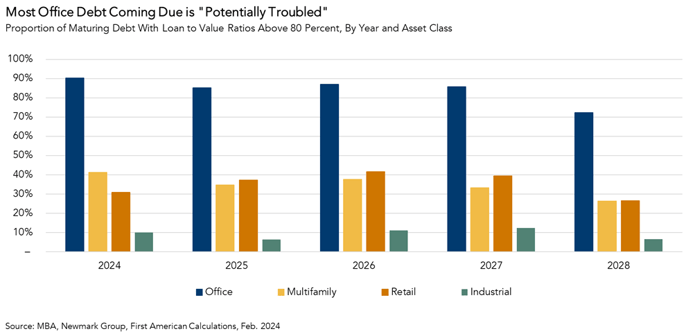
Though a lot of debt is coming due this year and next, maturing debt does not necessarily result in distress. As we discussed in a recent piece, debt maturities are more likely to result in distress when loan-to-value (LTV) ratios are high and, therefore, the ability of the property owner to refinance the full balance of their loan may be limited. Over the next three years, the quantity of “potentially troubled” debt, defined as loans with LTV ratios over 80 percent, varies considerably by asset class. By a large margin, office properties are facing the largest amount of potentially troubled loan maturities, followed by multifamily or retail (depending on the year), followed by industrial. Maturing loans with higher LTVs are more likely to result in property price reductions if the owner is unable to refinance and is forced into a sale.
Banks Don’t Hold All CRE Mortgages
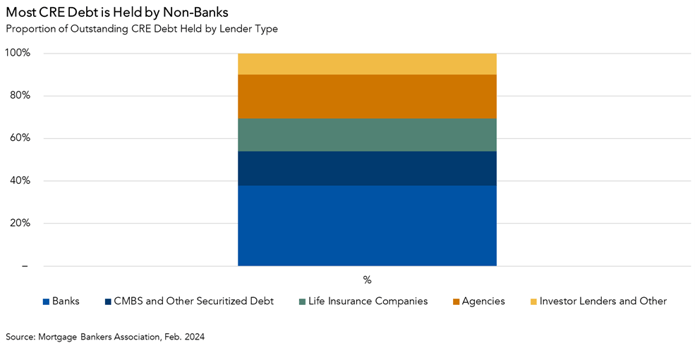
While all of this maturing CRE debt has brought attention to the risks that banks with greater exposure to CRE on their balance sheets may face, what’s often lost in the conversation about CRE mortgages is that there are a number of non-bank entities that also lend to CRE owners and operators. In fact, banks hold slightly less than 40% of all CRE debt outstanding. The rest is held by a combination of life insurance companies, agencies, and other types of investor lenders. Additionally, approximately 15% of CRE debt outstanding is comprised of commercial mortgage-backed securities (CMBS) and other collateralized debt obligations, which, unlike most other types of CRE debt, are more regularly traded.
Different types of mortgage holders can be more or less flexible about amending and restructuring outstanding debt. For example, investor lenders may have a higher tolerance for risk, given they are investing their money and not their depositors’ money, so they may be more willing to accept extended loan terms if they can be sufficiently compensated for the additional risk of a longer repayment period. CMBS, on the other hand, have special servicers who manage loans on behalf of a group of investors, so they are less flexible when terms of the loan are breached. Properties with less flexible debt types are more likely to face distress or foreclosure, and therefore price adjustments, upon maturity.
Some of the Slog is Over, but More Remains
Though some of the pain from CRE price adjustments is already behind us, there’s still more to come. Since so much debt matures this year, and since distressed debt workouts take time to resolve, the full downward impact of this year’s debt maturities on property prices and transaction volume will not be felt until the first or second quarter of 2025.


