It’s hard to know what apartment buildings are worth nowadays. With multifamily transaction volume at its lowest point in four years, comparable transactions, or “comps”, which are often used as a reference point to estimate value, are few and far between. The limited availability of comps increases the uncertainty of property valuation estimates. With fewer comps and greater valuation uncertainty, sellers will be hesitant to list since they don’t have a firm idea of what price they might get.
The lack of apartment transactions is having two major impacts on apartment capitalization (“cap”) rates[1]: it puts continued upward pressure on cap rates, and it makes cap rate-based valuation estimates of multifamily properties less certain.
“As long as there is a lack of good ‘comps,’ estimates of apartment property values will be less certain and multifamily cap rates will continue to rise.”
Scarce Data Makes Inferences of Value More Difficult
Valuing an illiquid asset in an environment with limited data is no easy task because private property prices aren’t like stock prices. Commercial properties don’t trade daily on an exchange, so they don’t carry a clearly stated price tag. Instead, their values need to be estimated by buyers and sellers alike, and one way to do that is by looking at comparable properties to see how much other buyers are willing to pay to acquire similar income streams.
These income streams are represented with cap rates. By relating a property’s price to the income it generates, a cap rate serves as a measure of the debt-free income yield [2] that a commercial property produces. But cap rates also work in the other direction. By linking the income produced by a commercial property back to its price, they are also regularly used as a valuation tool to infer the price of a commercial property that may not have traded in some time. Indeed, this is where cap rates get their name – they can be used to derive the capitalized value of an asset based on the income stream it produces. From this second perspective, cap rates based on transacted prices, or “transaction cap rates,” show how much buyers are willing to spend to acquire an income stream.
Purchasing Income
While selecting a cap rate with which to value a building is often as much an art as a science, if you can collect cap rates from multiple comps, you typically stand a better chance of getting to a true market-clearing price for a property than if you only have one or two. But if there aren’t many comps, then determining a proper cap rate with which to value a building becomes more difficult. Lower transaction volume, therefore, increases the uncertainty of any estimate of value that uses transaction cap rates.
If a similar, nearby property was purchased recently at a price that resulted in a 6 percent cap rate, then it’s easier to make the argument that the property you’re trying to value could also be sold at a price that results in roughly a 6 percent cap rate. But, what if there are no similar nearby properties?
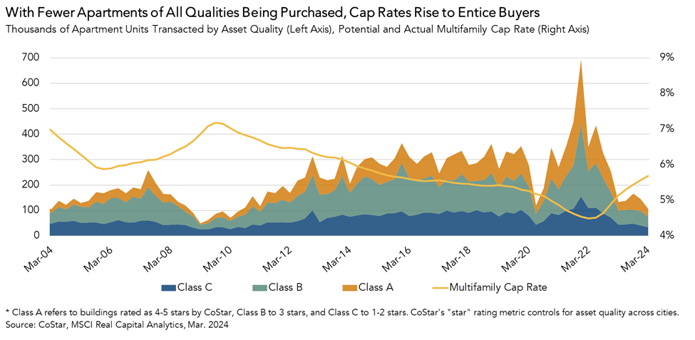
In terms of units transacted, which better controls for the changes in multifamily values over the last few years when measuring transaction volume, the first quarter of 2024 was the slowest since the early days of the pandemic. Fewer transactions, fewer “comps” to reference for valuation.
The decline in volume has been across apartment buildings of various quality. When volume peaked in the fourth quarter of 2021, higher-end Class A units made up a substantially larger share of all transacted units than they do today. At the time, about 37 percent of all apartment units purchased were Class A. Today, it’s 29 percent, while the proportion of Class C units trading has increased from 22 percent in the fourth quarter of 2021 to 32 percent today. Far fewer Class B units are being sold today than in 2021, but their share of all units sold has remained relatively steady, hovering at around 40 percent.
Fewer Transactions Mean Buyers Are Less Willing to Pay Top Dollar to Purchase Income
As we’ve described in a prior post, First American’s Multifamily Potential Cap Rate (PCR) model indicates that transaction volume is one of the main drivers of cap rates. With volume down, and limited comps available, there is greater pricing uncertainty in the market. This uncertainty is keeping many buyers on the sidelines until they can be more confident of securing a property at an attractive price. Sellers will have to lower their asking prices to motivate transactions, and that means higher transaction cap rates. As long as there is a lack of good “comps,” estimates of apartment property values will be less certain and multifamily cap rates will continue to rise.
First Quarter 2024 Multifamily Potential Cap Rate Model
- The multifamily PCR was 5.2 percent, an increase of 0.1 percentage points as compared with the fourth quarter of 2023.
- The multifamily PCR increased by 0.6 percentage points as compared with one year ago.
Multifamily Cap Rate Outlook Gap
- The actual multifamily cap rate was 0.5 percentage points higher than the multifamily PCR, which suggests that market fundamentals in the first quarter supported lower multifamily cap rates than were observed. However, given the low level of multifamily transaction volume, multifamily cap rate estimates are currently more uncertain.
- The gap between the actual multifamily cap rate and the multifamily PCR remained the same in the first quarter of 2024 as compared to the fourth quarter of 2023.
First Quarter 2024 Industrial Potential Cap Rate Model
First American’s Industrial PCR Model estimates a potential national cap rate for industrial properties based on several industrial property market fundamentals, including industrial vacancy rates, eCommerce sales, construction starts and commercial mortgage flows.
- The industrial PCR was 6.7 percent, an increase of 0.5 percentage points as compared with the fourth quarter of 2023.
- The industrial PCR increased by 1.4 percentage points as compared with one year ago.
Industrial Cap Rate Outlook Gap
- The gap between the actual industrial cap rate and the industrial PCR provides insight into the likelihood of shifts in the actual cap rate. If the industrial PCR is below the actual industrial cap rate, it indicates that fundamentals supported lower cap rates than were observed. If the industrial PCR is above the actual industrial cap rate, it indicates that fundamentals supported higher cap rates than were observed.
- In the first quarter of 2024, the actual national industrial cap rate of 6.3 percent was 0.4 percentage points lower than the industrial PCR, indicating that market fundamentals supported a slightly higher industrial cap rate than was observed in the first quarter.
- The gap between the industrial PCR and the actual industrial cap rate expanded, from 0.1 percentage points in the fourth quarter of 2023 to 0.4 percentage points in the first quarter of 2024.
First Quarter 2024 All-Asset Potential Cap Rate Model
First American’s All-Asset PCR Model estimates a potential national cap rate for all asset classes based on several CRE market fundamentals, including rental income, prevailing occupancy rates, interest rates, the amount of commercial mortgage debt in the economy, and recent property price trends..
- The all-asset PCR was 5.8 percent, a decline of 0.1 percentage points compared to the fourth quarter of 2023.
- The all-asset PCR increased by 0.3 percentage points as compared with one year ago.
All-Asset Cap Rate Outlook Gap
- The actual all-asset cap rate was 0.5 percentage points higher than the PCR, which suggests that market fundamentals in the fourth quarter supported slightly lower actual cap rates than were observed. This represents an increase in the gap between the all-asset PCR and the actual all-asset cap rate of 0.4 percentage points compared to the fourth quarter of 2023.
About the Multifamily Potential Cap Rate Model
The multifamily Potential Cap Rate (PCR) Model estimates cap rates based on the historical relationship between multifamily transaction volume, annual changes in renter household formation, and multifamily mortgage flows. The multifamily PCR Model uses these metrics to establish a potential cap rate level that is supported by these market fundamentals. When actual multifamily cap rates are significantly above the multifamily PCR, it indicates that market fundamentals supported lower cap rates than were observed. Conversely, when actual cap rates are significantly below the potential cap rate level, market fundamentals supported higher cap rates than were observed. Multifamily cap rates are aggregated nationally, and the PCR Model is updated quarterly.
[1] A cap rate is one measure of estimated yield, or return, on investment provided by a building and is equal to the net operating income (“NOI”) generated by the building divided by the price of the building. For example, a property purchased for $100,000 that generates income of $10,000 a year has a cap rate of 10 percent. All else held equal, higher cap rates represent higher rates of return on income and lower valuations. Since cap rates do not take debt service into consideration, cap rates are a measure of what is called unlevered yield.
[2] Debt-free yield means the yield achieved if a commercial property were purchased without a mortgage.


